The City of Como project is a collaboration with Fluxedo, an Italian startup working in partnership with the municipality of Como to model human dynamic flow in the city.
The overall aim of the project is to integrate multiple and diverse data sources to build
a picture of the way people live and move around the city.
Using historical telecom and social media data along with other geolocated data,
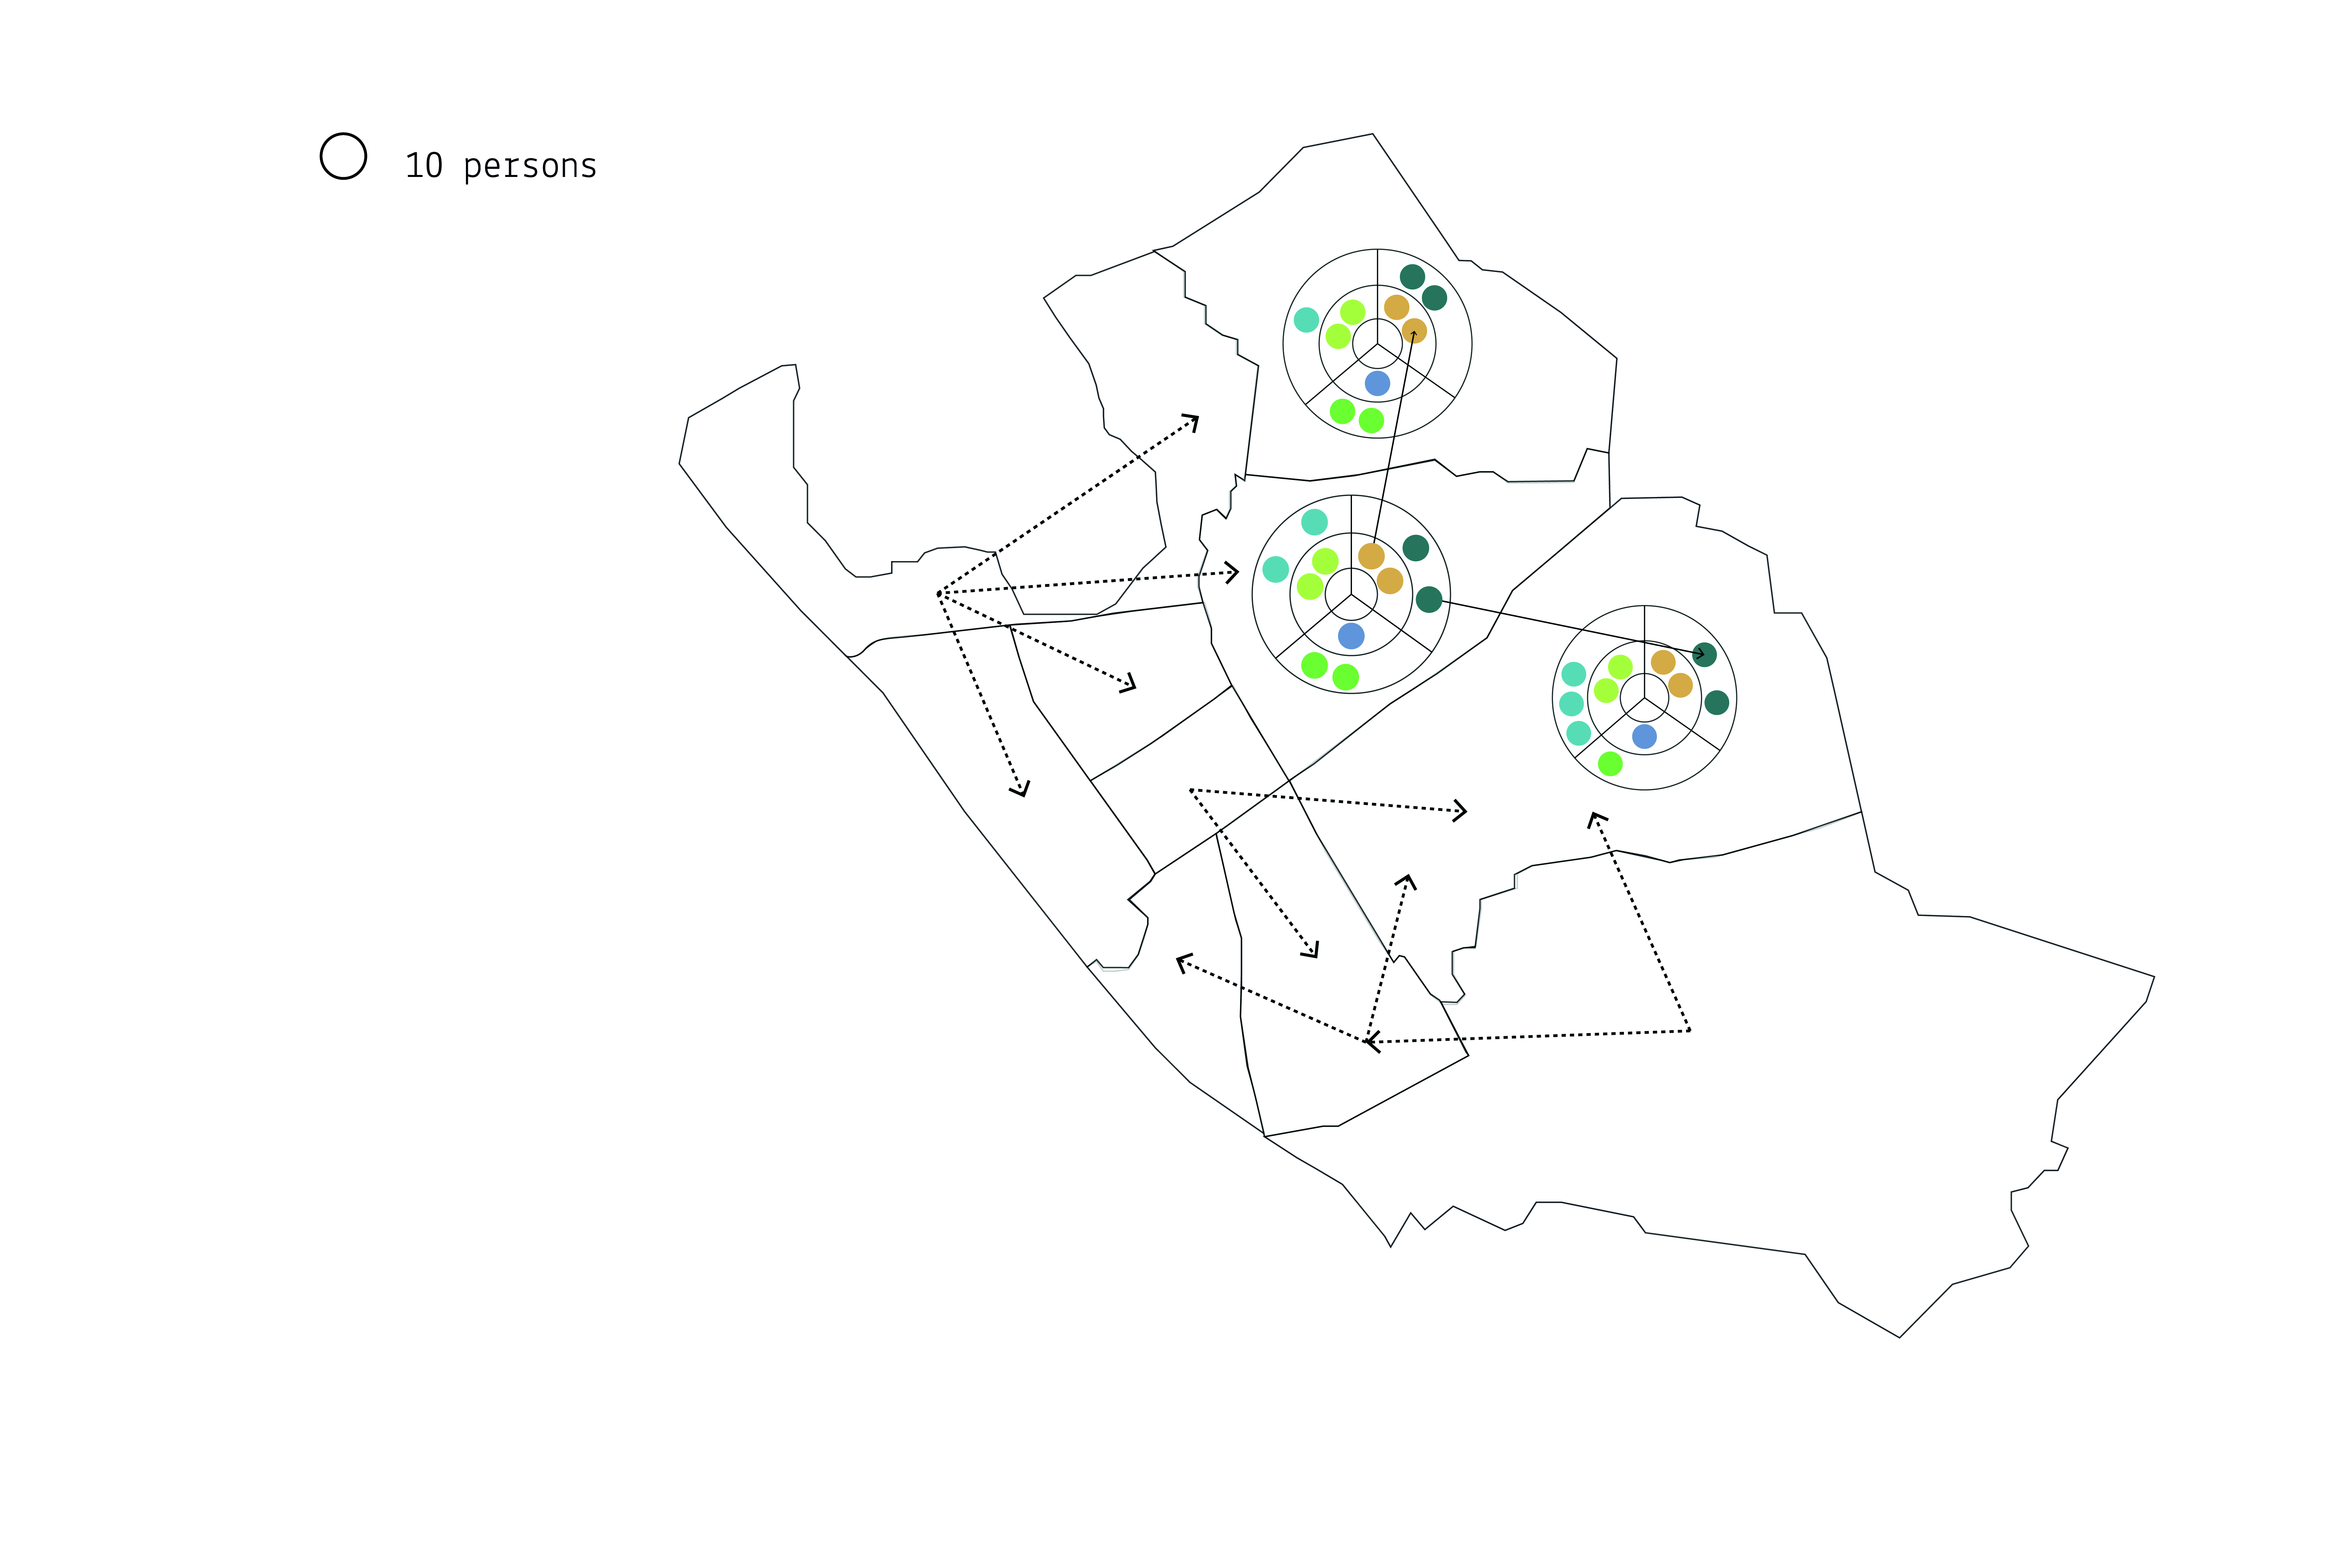
we have created an intuitive visualisation of several models of daily movements of different demographic groups throughout
Como dependent on the day and time.
We have also explored the motivations for movement throughout the city based on social media activity and content.
Como is a touristic city
Tourists per year
1,072,887
As a large proportion of the revenue of the city is due to to tourism,the city is interested in better understanding how to cater for them and use resources more effectively.
While the municipality have conducted analyses of telecom data in the past,
we have been able to provide a more intuitive visualisation of the data, which was too fine grained to be
effectively understood in both spatial and temporal dimensions.
<
Como is a beautiful italian city
Time and space
To facilitate the use of telecom data while preserving privacy concerns,
the data was aggregated at the level of 10 regions of the city and at an hourly level.
Data covered the period between June 1st and October 31st, which we believe captures three phrases of activity in Como.
Modelling movement
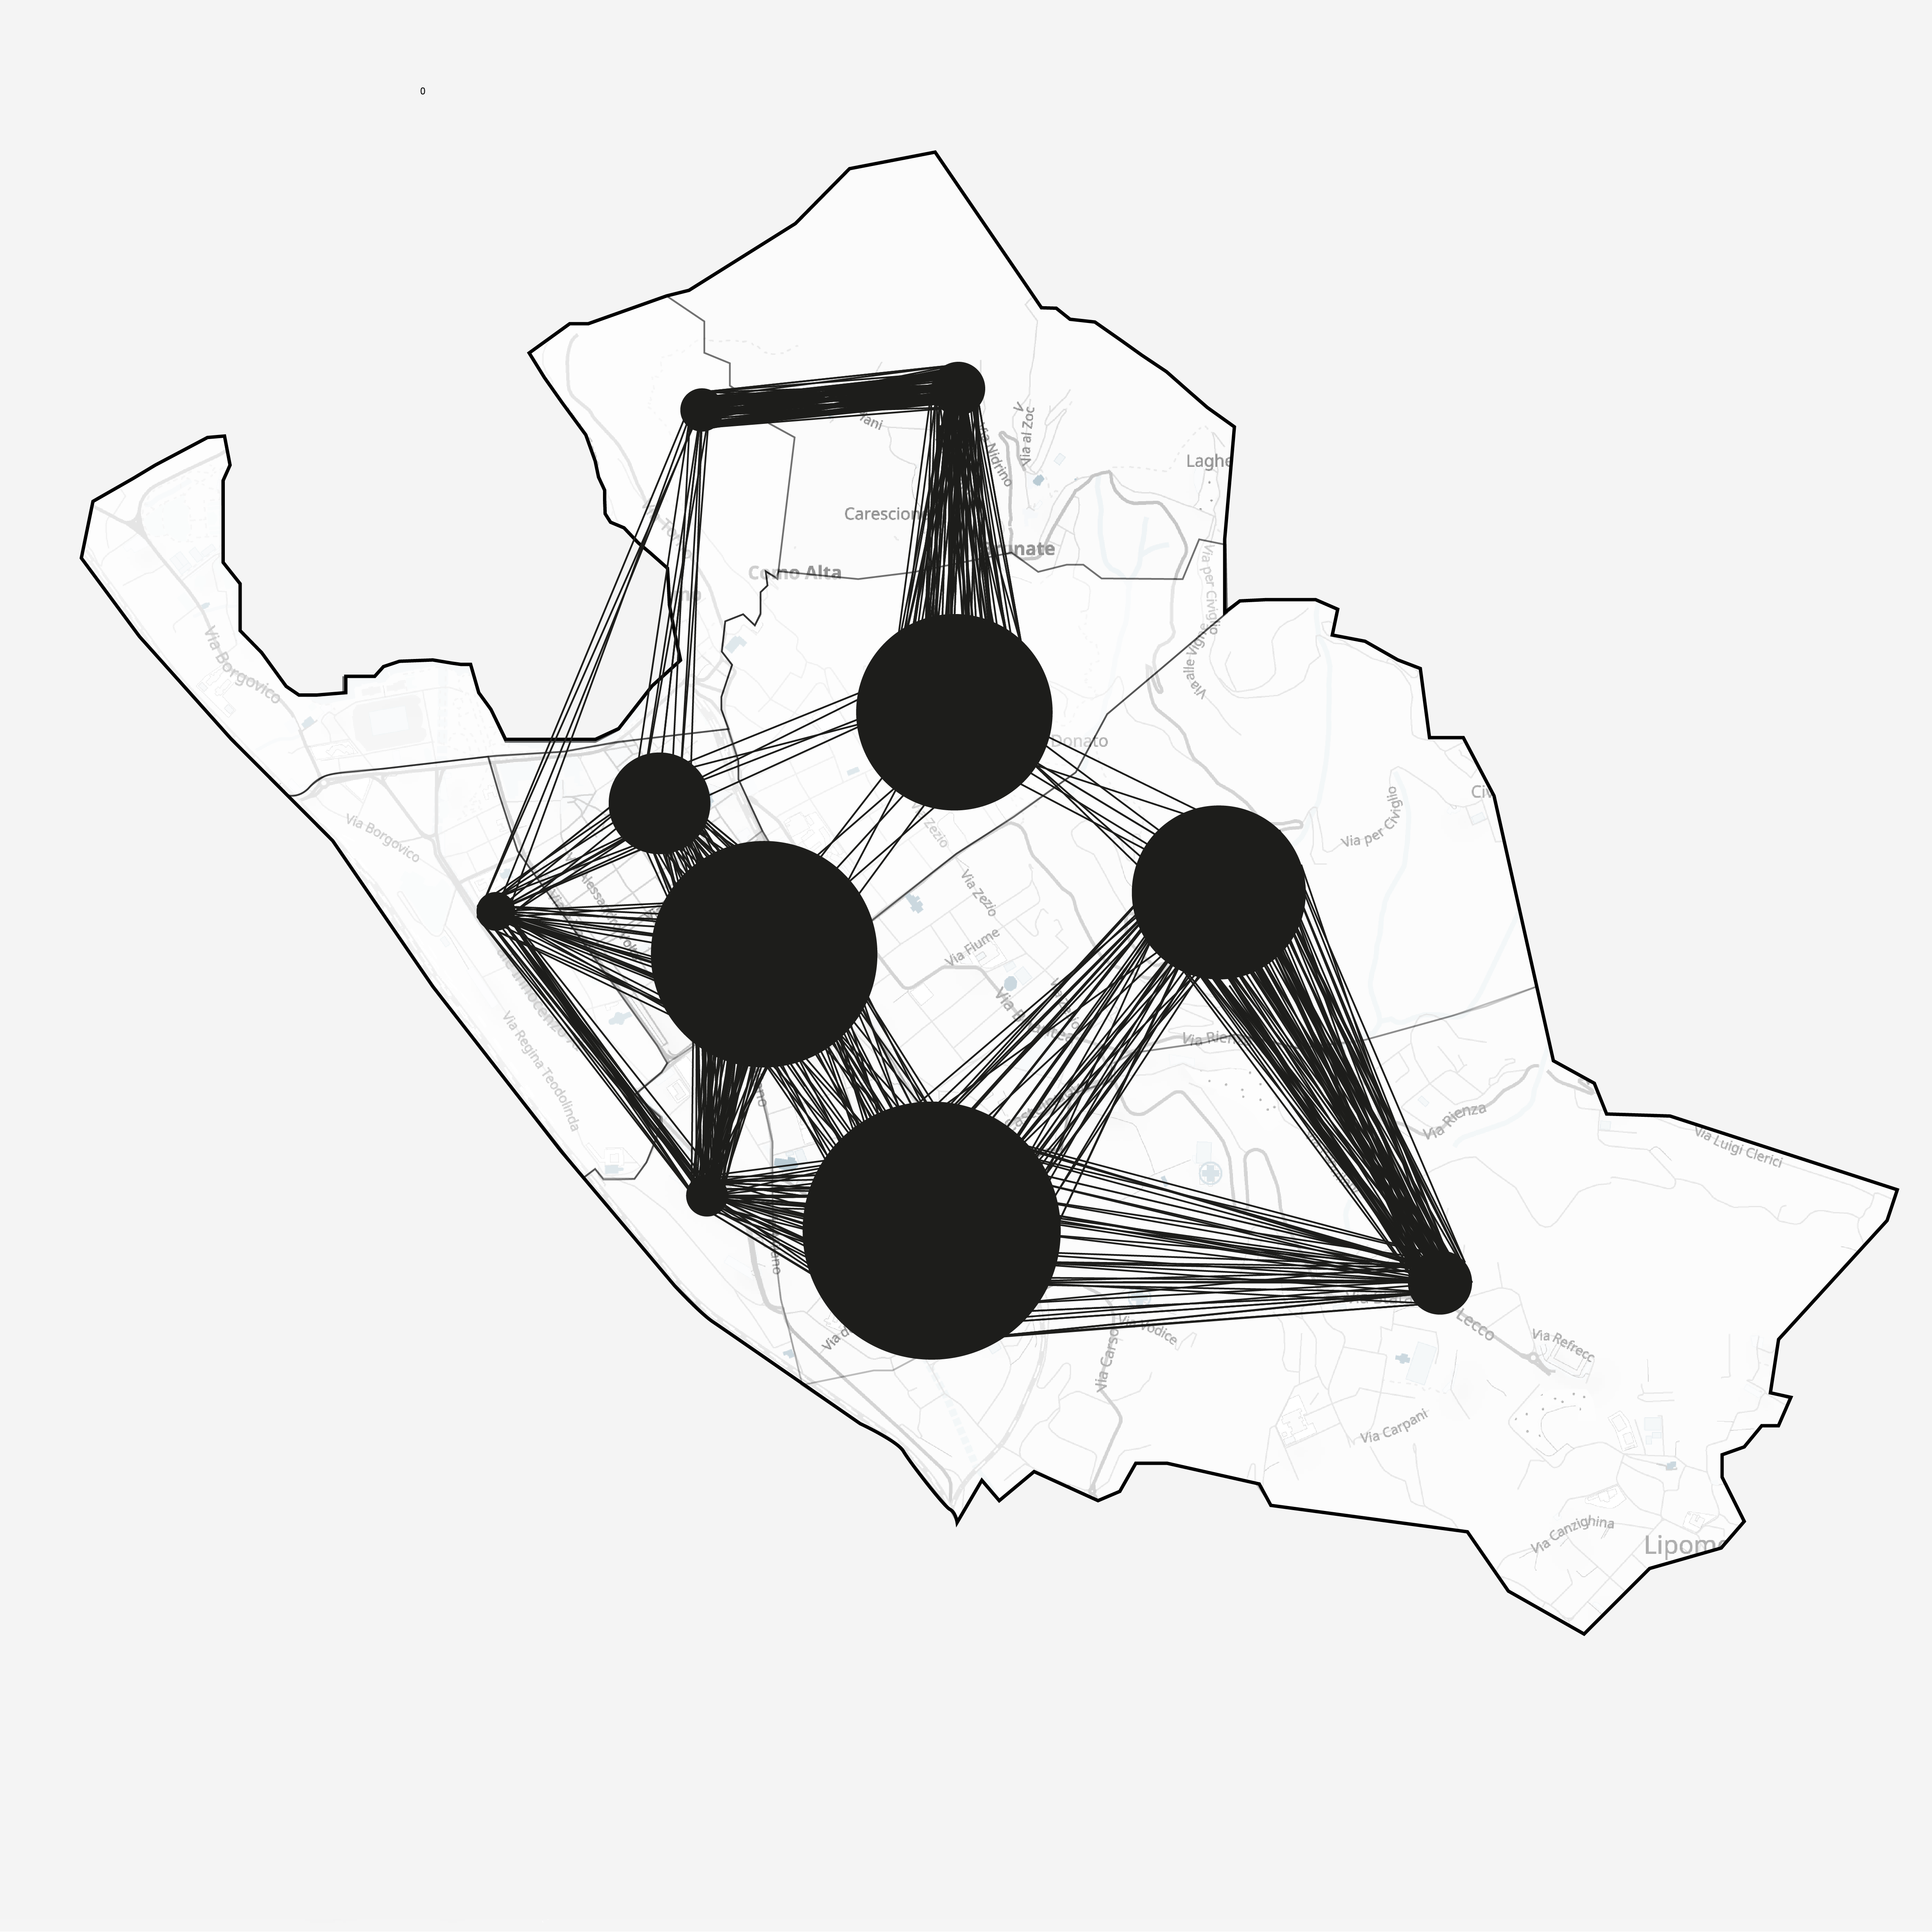
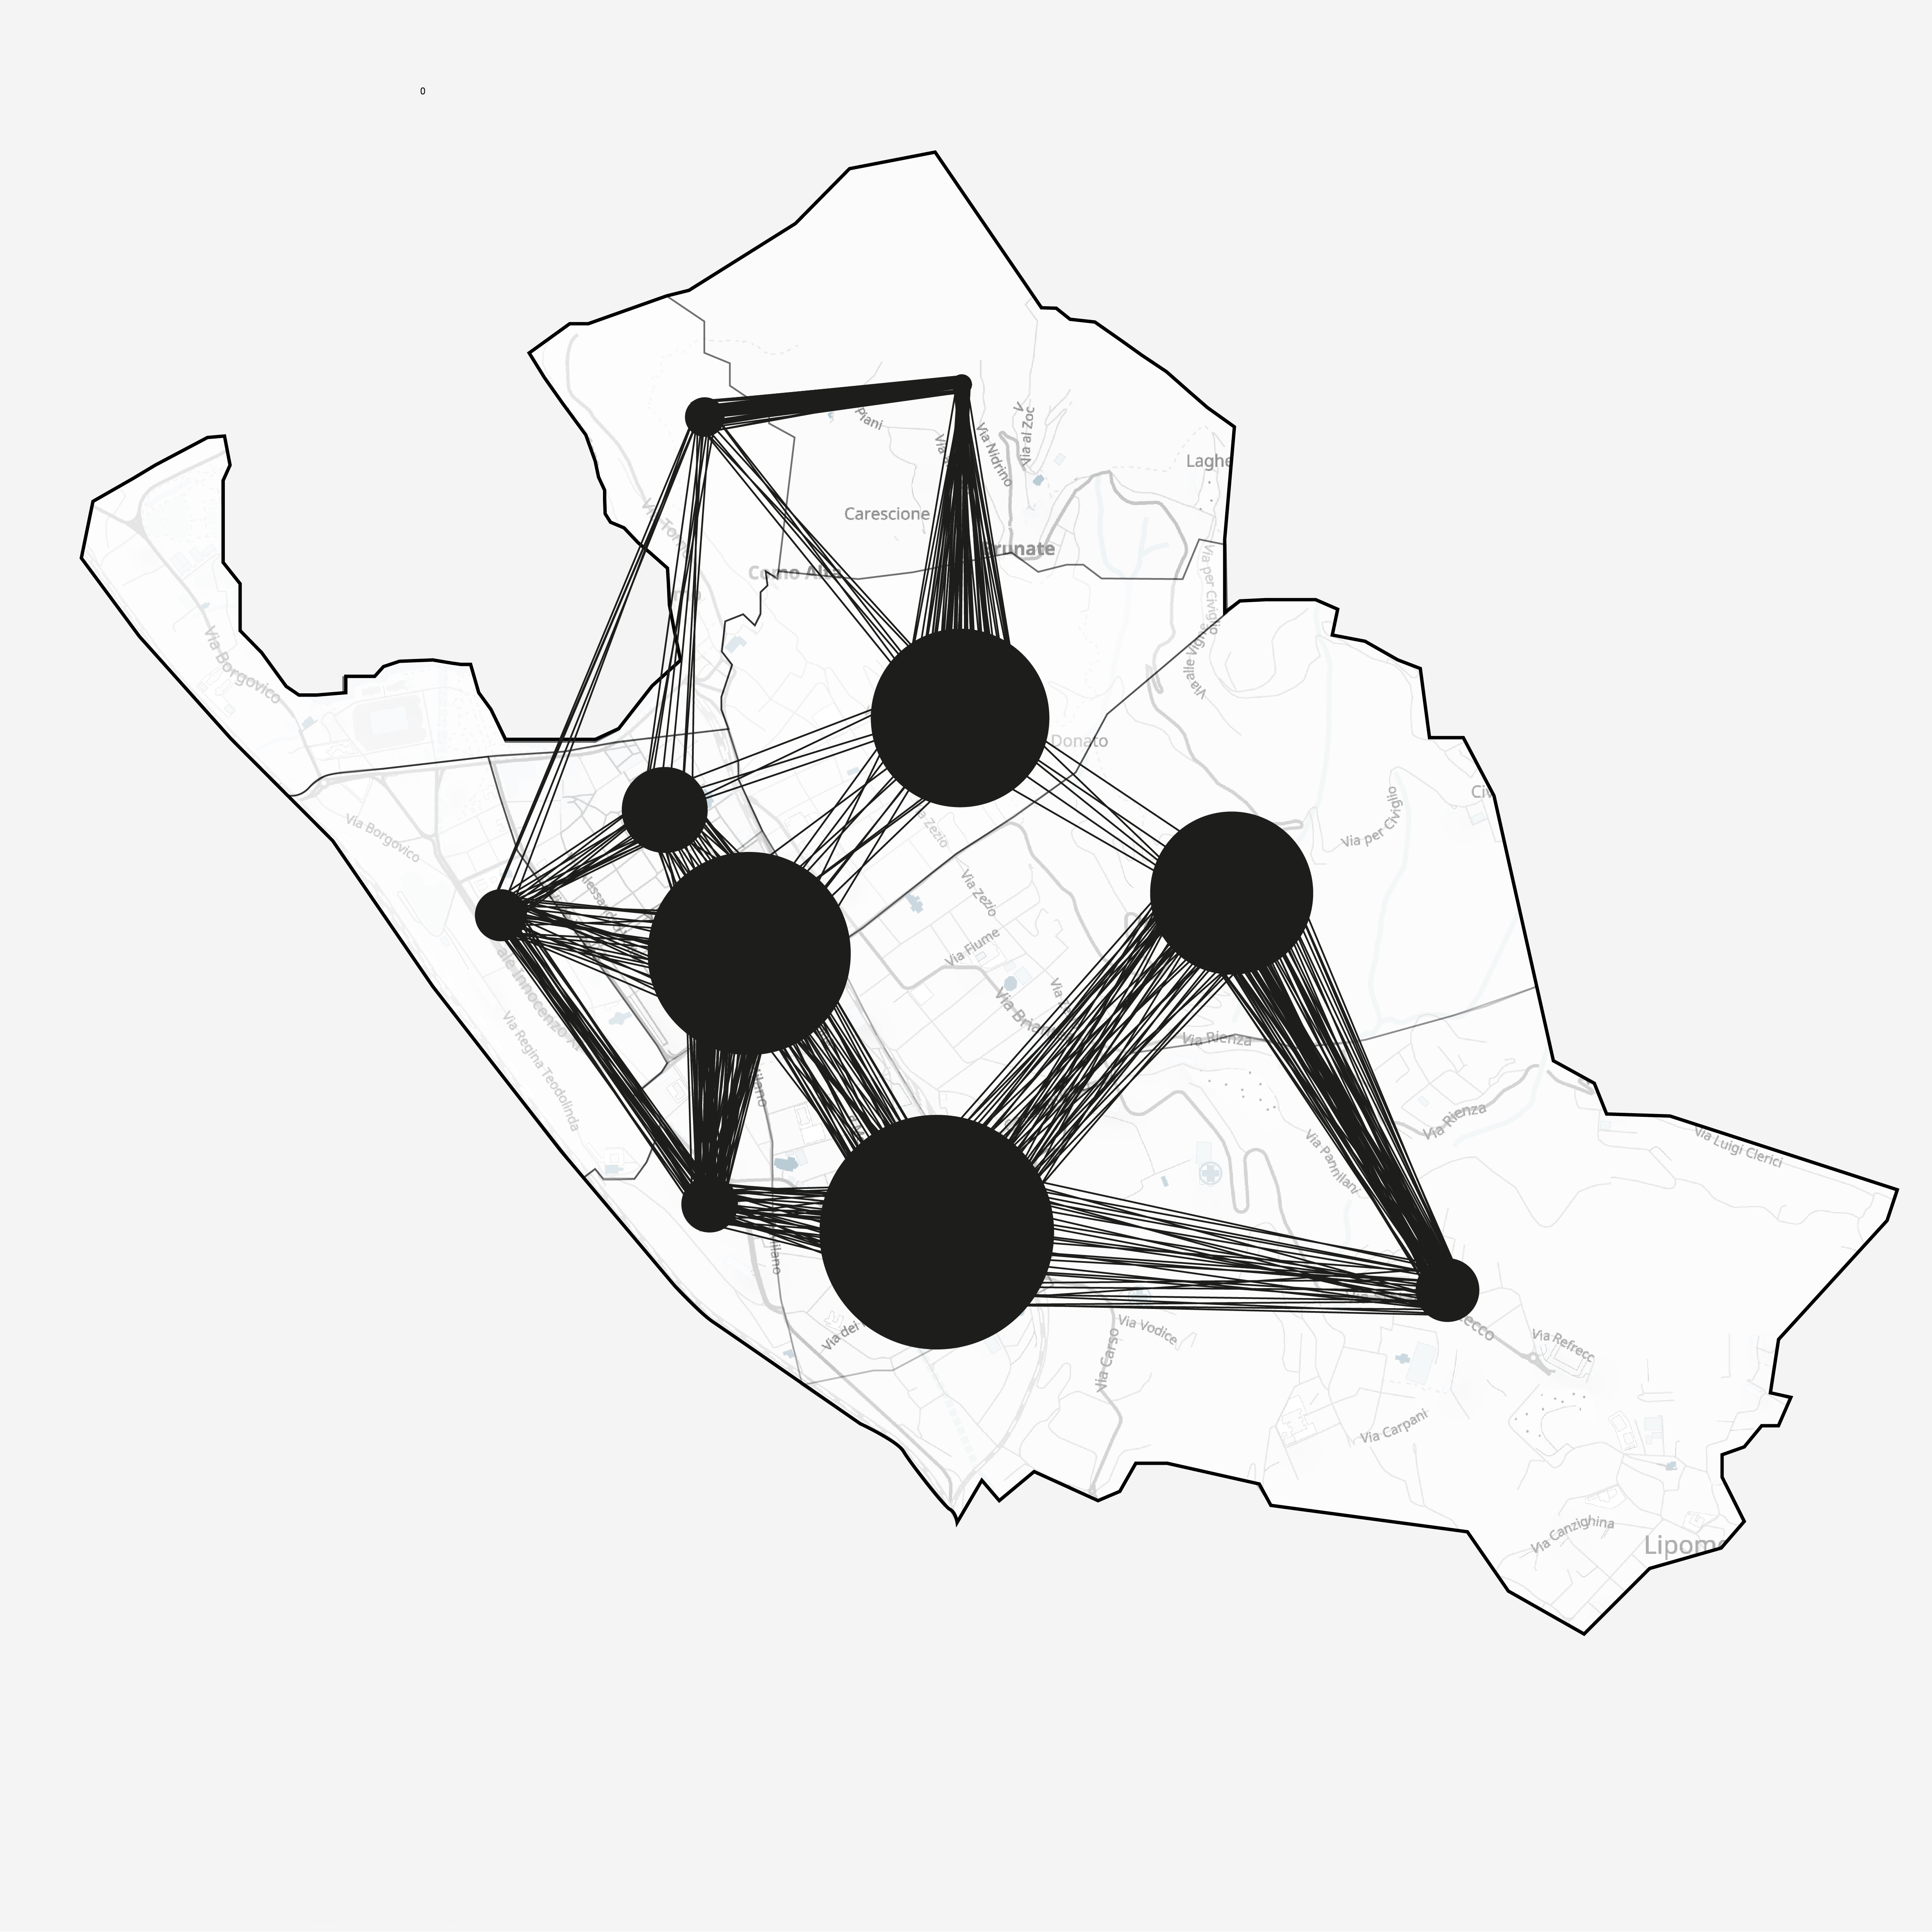
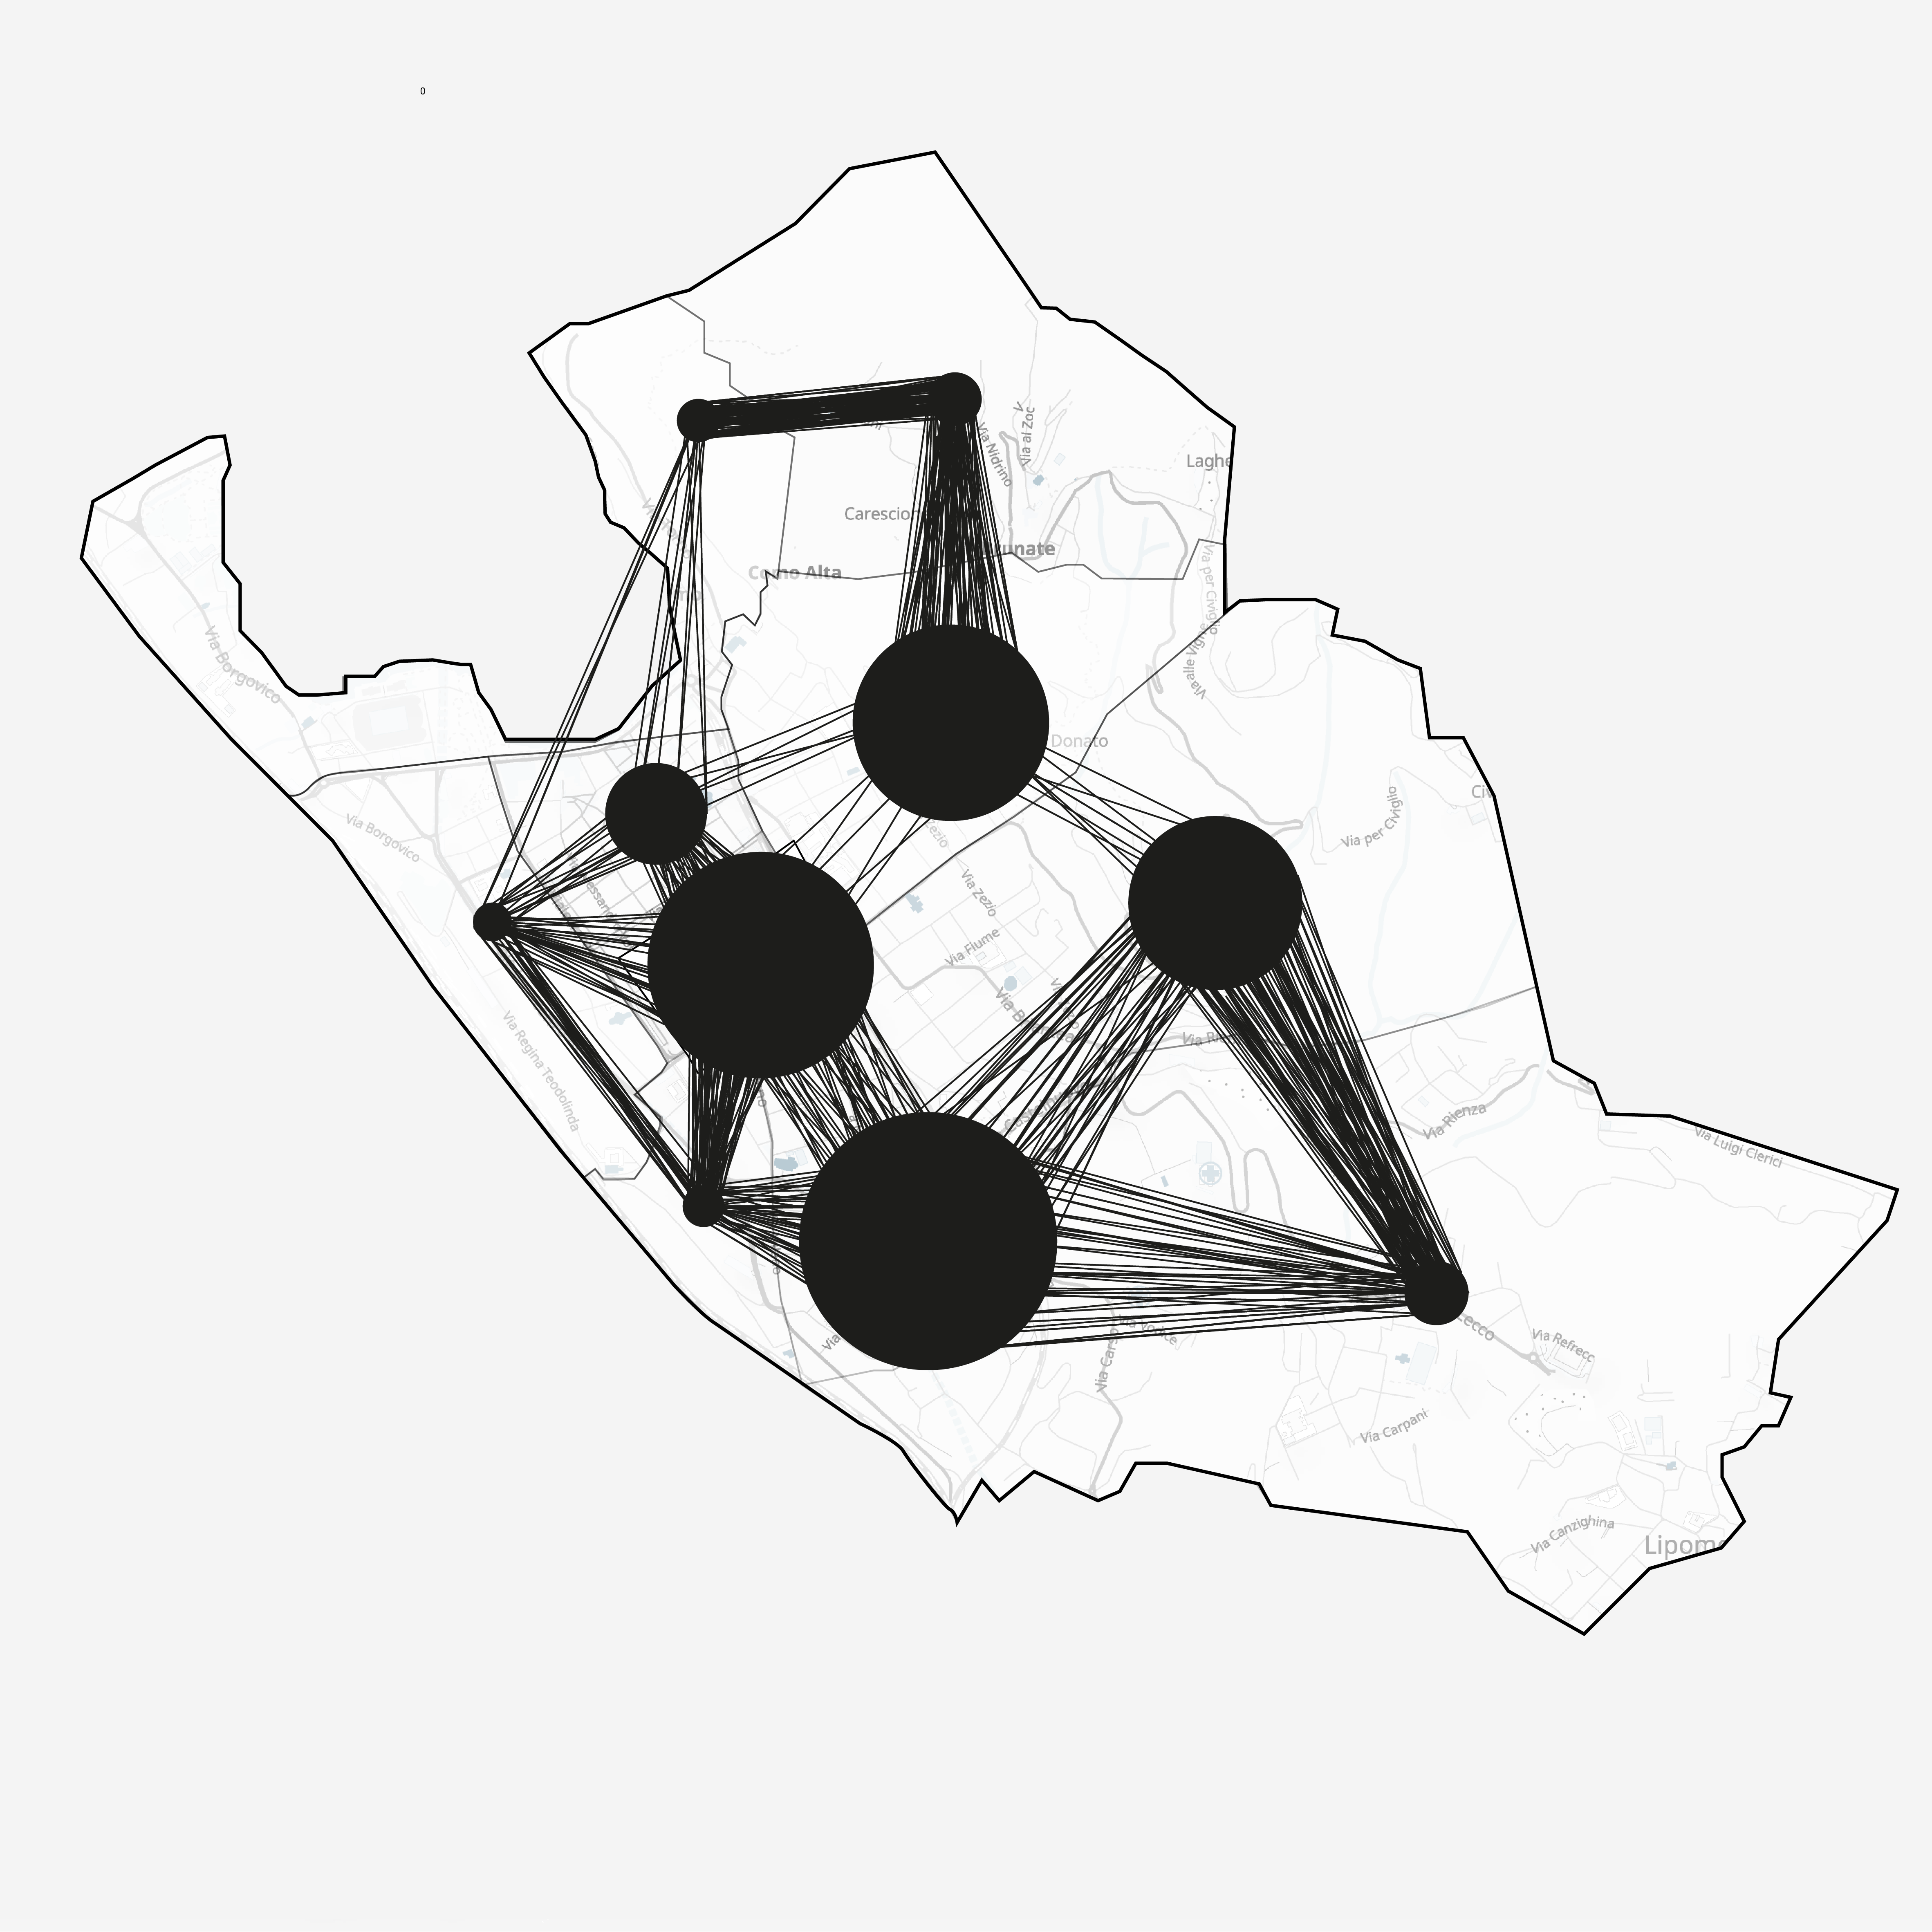
Where do people move
The data is available to us at several granularities: at both daily and hourly levels and at region
and full city levels. The data is also subsetted based on gender and age range, among other factors
we did not consider (largely because the privacy protection resulted in a large amount of missing data).
While inspecting the data, we realized that there was a significant amount of overcounting occurring.
That is, the data aggregated from the hourly and region level data resulted in significantly
more people counted than the total number of people in the city for a given day.
This is due to the fact that within any given hour if an individual connects to a cell phone tower
in two different regions, he or she will be counted in both. This presents an interesting modeling case
in which we have added data about possible movement patterns embedded in the total data, but it is difficult
to extract the number of people in any given region at any given time. We chose two models to deal with
this problem: a linear-program based model which assigns people to specific physically possible routes through
the city (regions passed through within any given hour), and a spatial Gaussian process smoothing model,
which should give us the general feel of popularity of a given area abstracted from the absolute
numerical counts.
Linear Programming Model
Linear programming is a method to calculate the optimal allocation between elements in a linear objective function subject
to linear equality and inequality constraints. That is, linear programming methods solve a problem of the form:
maximize cTsubject to Ax=b
and Gx < h
The key insight behind the application of the linear programming model is that the double counts and the total city count
are related through the paths that people followed over any given hour. In particular, the total number
of people overcounted is exactly equal to the number of regions passed through by individuals beyond the first region they
appeared in. Therefore, we can enumerate possible paths through the city and attempt to map people onto them by setting up a
linear programming problem that weights shorter paths as more likely and is subject to the constraints that the total number
of people in any region or hour must sum to the ground truth provided by the whole city data.
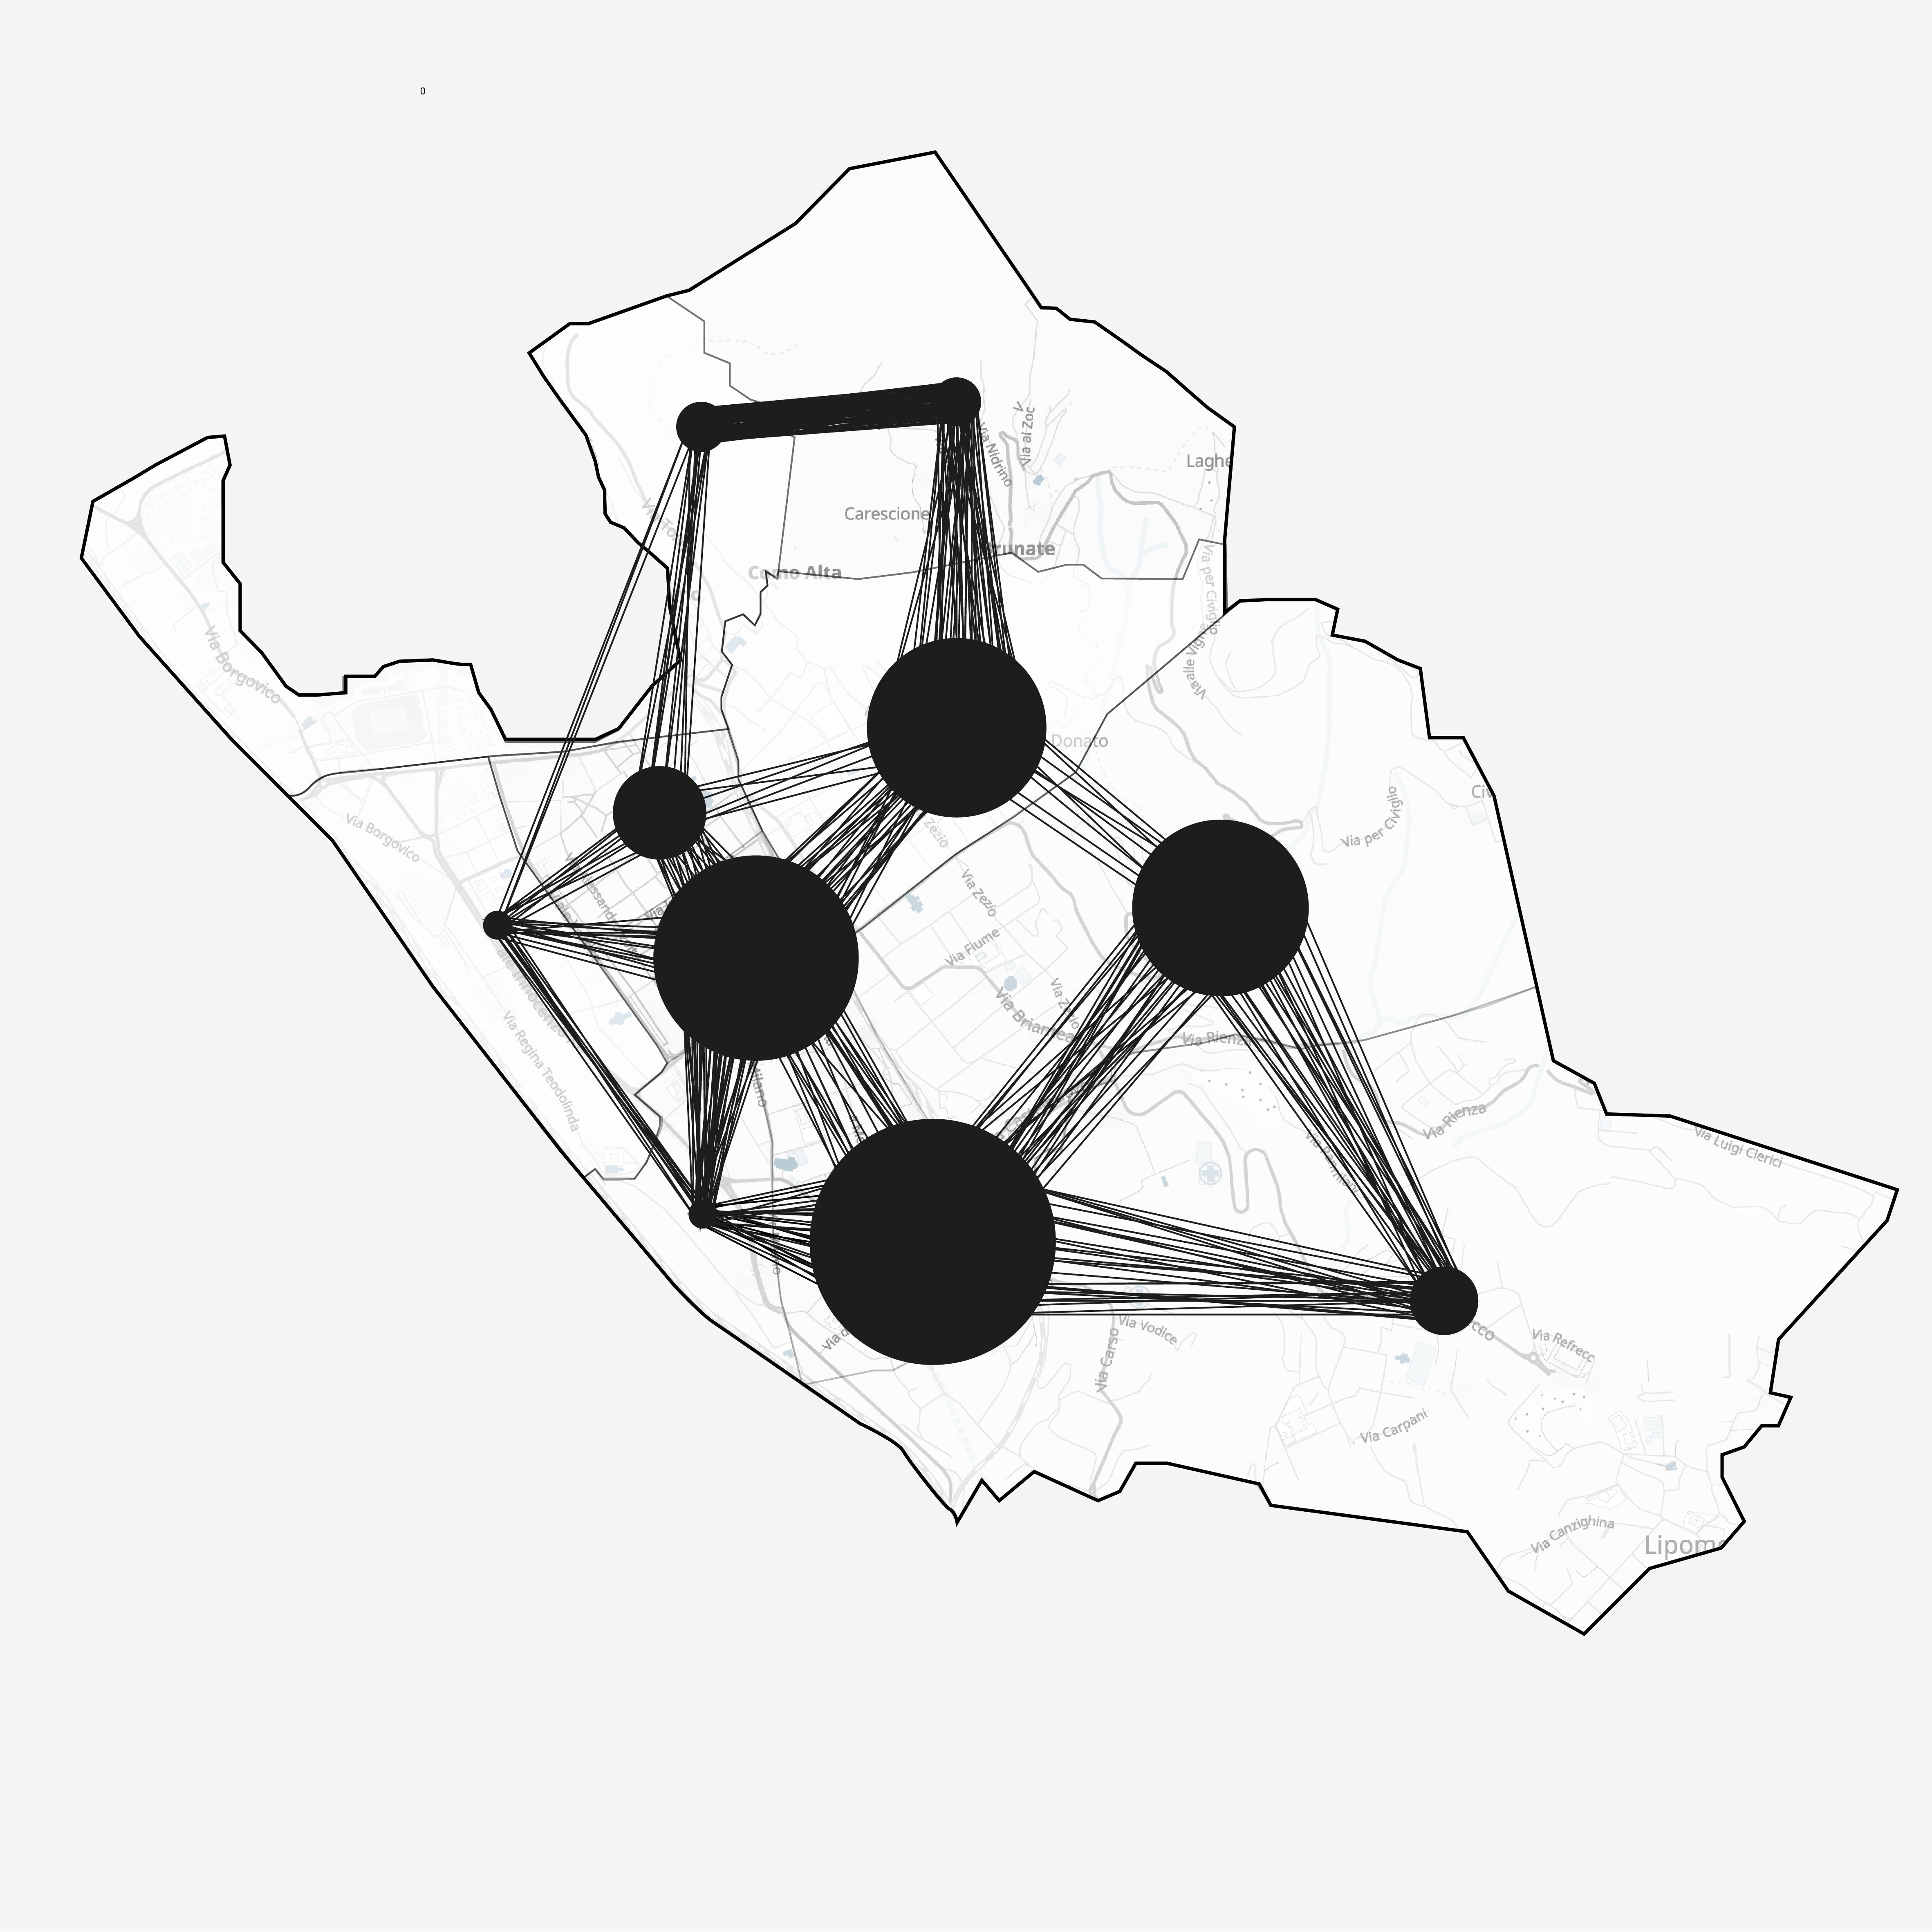
By considering the structure of the map regions, we enumerate all possible directed paths. That is, because region 6 is
connected to regions 8, 5, 2, and 7, {6,8}, {6,5}, {6,2}, and {6,7} are legal paths whereas {6,3} is not.
If we assume that in general people are more likely to have been on shorter paths, this leads to the construction of our
objective function for any given transition hour as:
Where x1 is the vector of dummy variables for all paths of length 1, x2 is the vector of dummy variables for all paths
of length 2, and x3 is the vector of dummy variables for all paths of length 3 and a1 > a2 > a3.
The simplest form of the problem is to enumerate dummies for all possible paths, with the resulting coefficients being
the number of people who were on such a path in that hour (i.e. passed through those regions of the city) subject to the constraints that for every region, the total number of people who passed through that region has to be equal to the number of people logged in that region during that hour and the total number of people in the city (the sum of all of the coefficients) has to sum to the total number of unique people logged in the city. This results in a general formulation of the constraint matrices A and G as large, sparse 0,1 matrices. Then, we can see this will allow for the double counting, as a path {6,5,10} will contribute one person each to the counts for
the regional constraints but only a single person to the total unique persons constraint.
Now, note that this basic form of the problem is not in general well-specified. For a simple example, if we know that there are
2 total people in the city and we have the region counts 1:1, 2:1, and 3:1, we cannot distinguish between the solutions {1,2}:1, {3}:1 and {1,3}:1, {2}:1. In fact, when we run the problem with only these constraints, there are a huge number of feasible solutions and we do not attain a reasonable dispersion of people throughout the city.
However, the structure of the datasets we were provided naturally leads to a large number of possible additional
constraints in a linear programming environment. In particular, any given subset (gender, age range, country/province) provided
should sum over all possible paths including that variable to the total number reported in that dataset.
We computed these linear programs on a pairwise hourly level subject to the additional temporal constraint that the number
of people moving to a region in any given hour (that is, on a path that ends in that region) must be lower than the total
number of people who are in that region in the next hour. People who leave the city are assumed to have left from a single
region. Additionally, we limit people to have been in at most three regions in any one hour. These simplifications lead to a
linear program that is quite well-specified and leads to a reasonable dispersion of people over paths in any given hour
Gaussian model
Another option for interpreting the noisy, overcounted data is to focus on the general direction of the number of
people in any given region relative to that region at other points in the timeframe and relative to other surrounding regions.
For this we use kriging, or Gaussian process regression, a spatial interpolation method in which data samples are interpreted
as being noisy estimates from an underlying random process with prior covariances.
In particular, we know that the data samples we have are stochastic estimates of the true number of people in a region at
any given time, and we expect that because people must flow through the city smoothly (that is, they cannot teleport from one
region to another), the covariance between the population count at different regions should increase as the distance between
those two regions decreases.
We can check that this assumption is true by plotting the covariogram of the data points:
References
Using Mobile Phone Data to Analyze Movement of People
Dan, Y., & He, Z. (2010). A dynamic model for urban population density estimation using mobile phone location data. 2010 5th IEEE Conference on Industrial Electronics and Applications. doi:10.1109/iciea.2010.5514844
Song C, Qu Z, Blumm N, Barabási A-L (2010). Limits of predictability in human mobility. Science 327(5968):1018–1021
Linear Programming / Markov Chains
Bernstein, G., Sheldon, D. (2016). Consistently Estimating Markov Chains with Noisy Aggregate Data. arXiv:1604.04182
Luedtke, J., Ahmed, S., & Nemhauser, G. (n.d.). An Integer Programming Approach for Linear Programs with Probabilistic Constraints. Integer Programming and Combinatorial Optimization Lecture Notes in Computer Science,410-423. doi:10.1007/978-3-540-72792-7_31
Gaussian Processes
Flaxman, S. (2014). A General Approach to Prediction and Forecasting Crime Rates with Gaussian Processes
Geoff Bohling,2005,Kriging
Hartikainen, J., Jylänki, P., Riihimäki, J., Tolvanen, V., Vanhatalo, J., & Vehtari, A. (2013). GPstuff: Bayesian modeling with Gaussian processes. Journal of Machine Learning Research, 14, 1175-1179.
Visualisations
URBAN LENS. (n.d.). Retrieved March 31, 2017, from http://senseable.mit.edu/urban-lens/
Yau, N. (2017, March 10). A Day in the Life of Americans. Retrieved March 31, 2017, from http://flowingdata.com/2015/12/15/a-day-in-the-life-of-americans/
C. (n.d.). Living Cities - A shared cartographic experiment from HERE and CartoDB. Retrieved March 31, 2017, from http://livingcities.here.com/#cities/london/51.505/-0.188/11/
Big Data Visualization & Society - Riyadh. (n.d.). Retrieved March 31, 2017, from http://dataviz-riyadh.mit.edu/projects.html
Stitch Fix Algorithms Tour - (n.d.) Retrieved May 9th, 2017, from http://algorithms-tour.stitchfix.com/
Modelling Insights
Where do people move
Screenshots from the model and the insights we gained
Tuesday 2PM
Tuesday 6PM
Saturday 8PM
Saturday 10PM
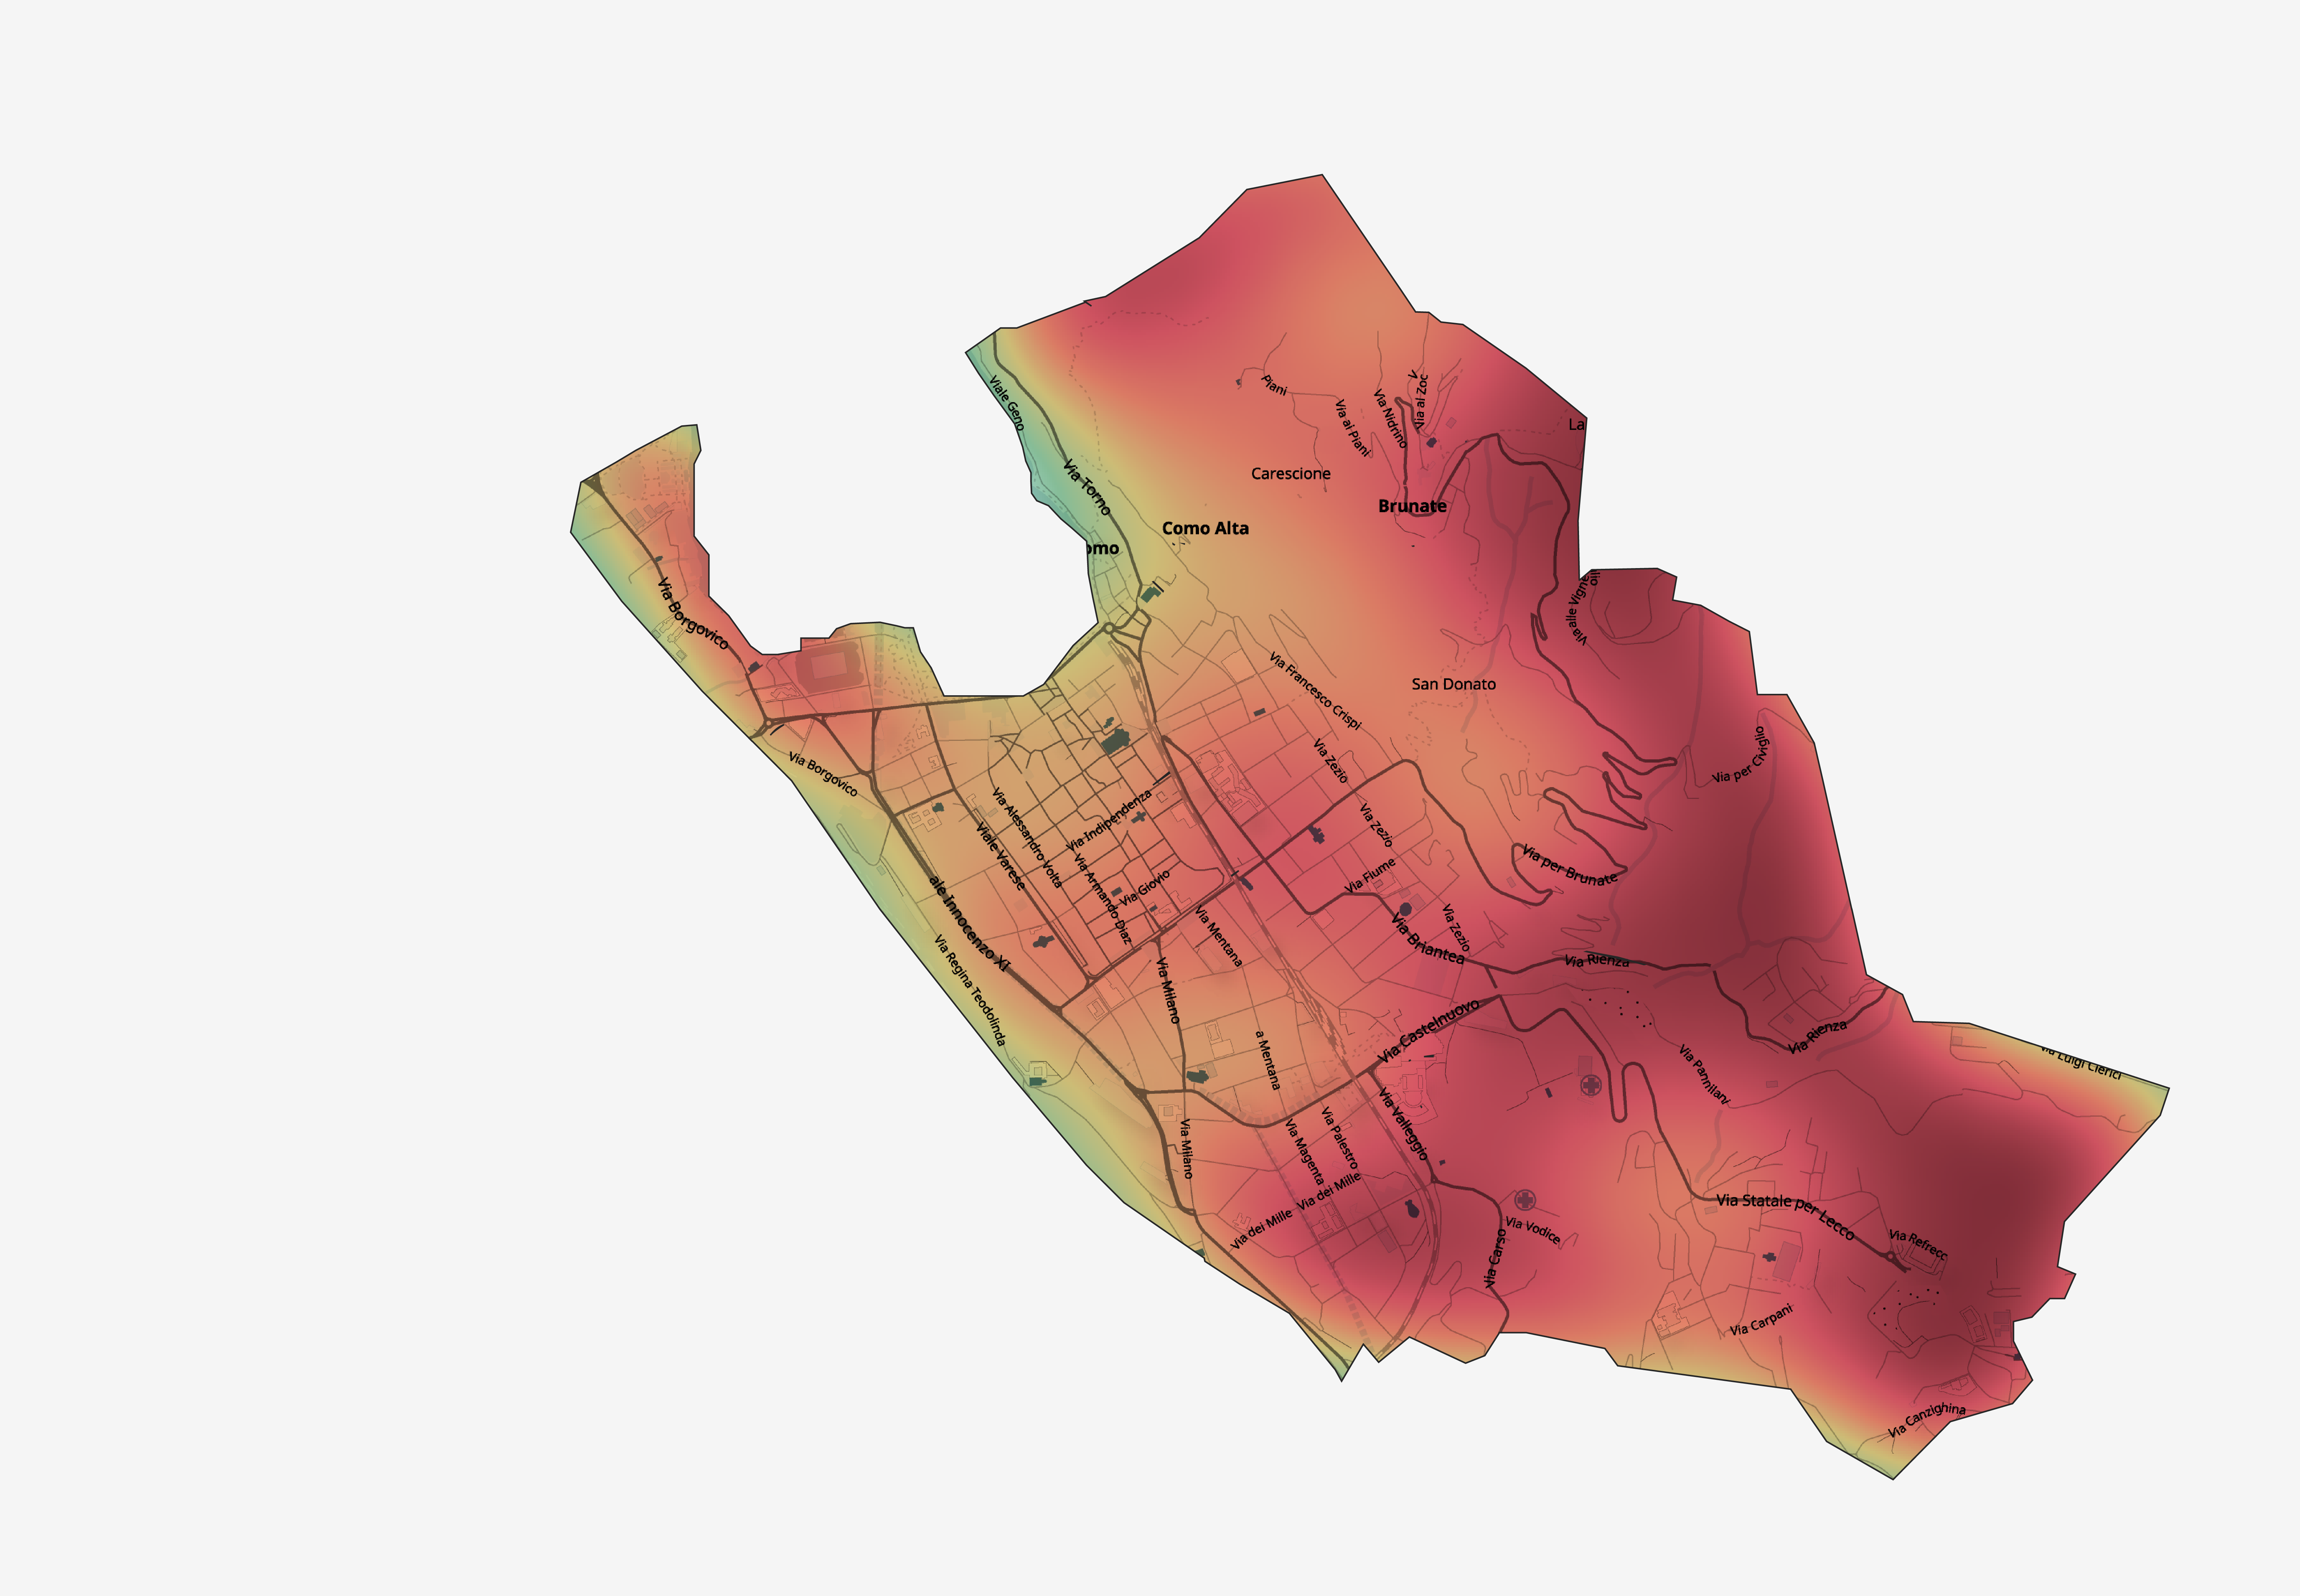
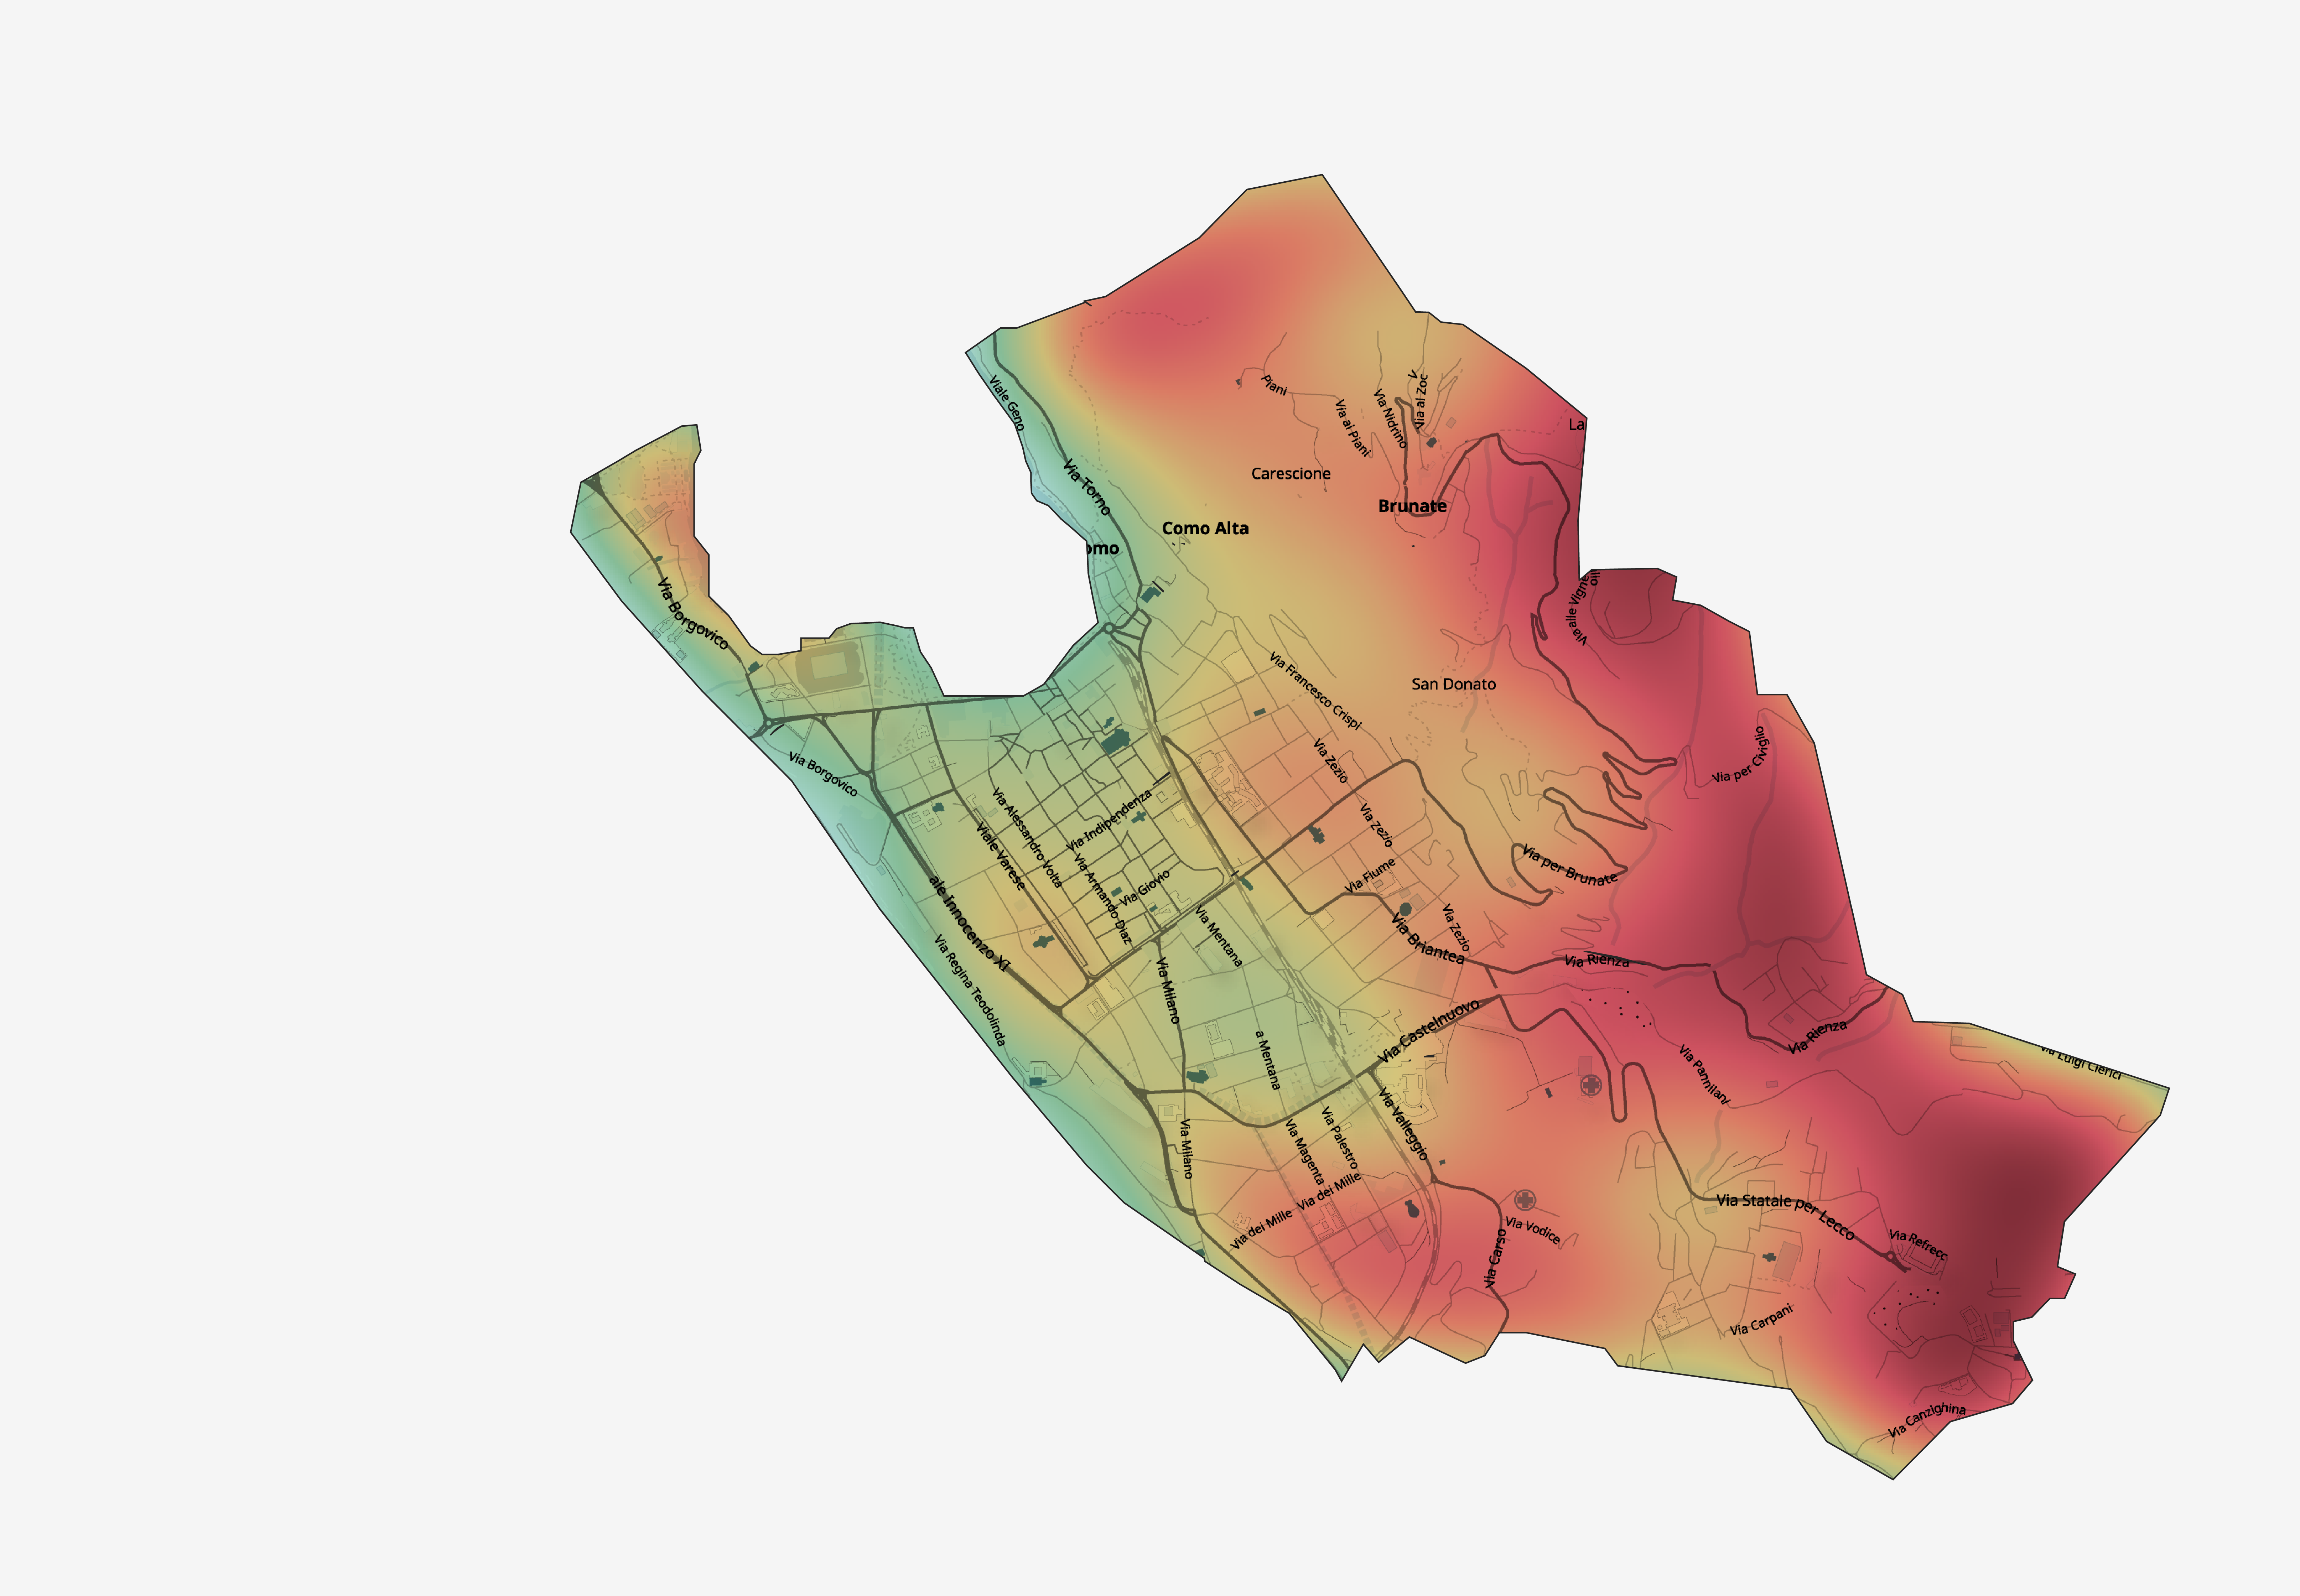
Error map with telecom only
Error map with telecom and parking
Motivations for Movement
BEHIND Reasons why
As well as understanding how people move through the city, we explored some of
the reasons why.
Initially we explored using geolocated social media posts including Twitter, Instagram and TripAdvisor as indicators of activity.
Although the posts are too sparse to be a useful signal of activity level, they can be used to infer the types of activities
associated with each region of the city. We started by developing a representation of two time periods
(Tuesday afternoon and Saturday evening) in the TripAdvisor and Instagram data. We analyzed all of the checkins on the TripAdvisor app bucketed by region.
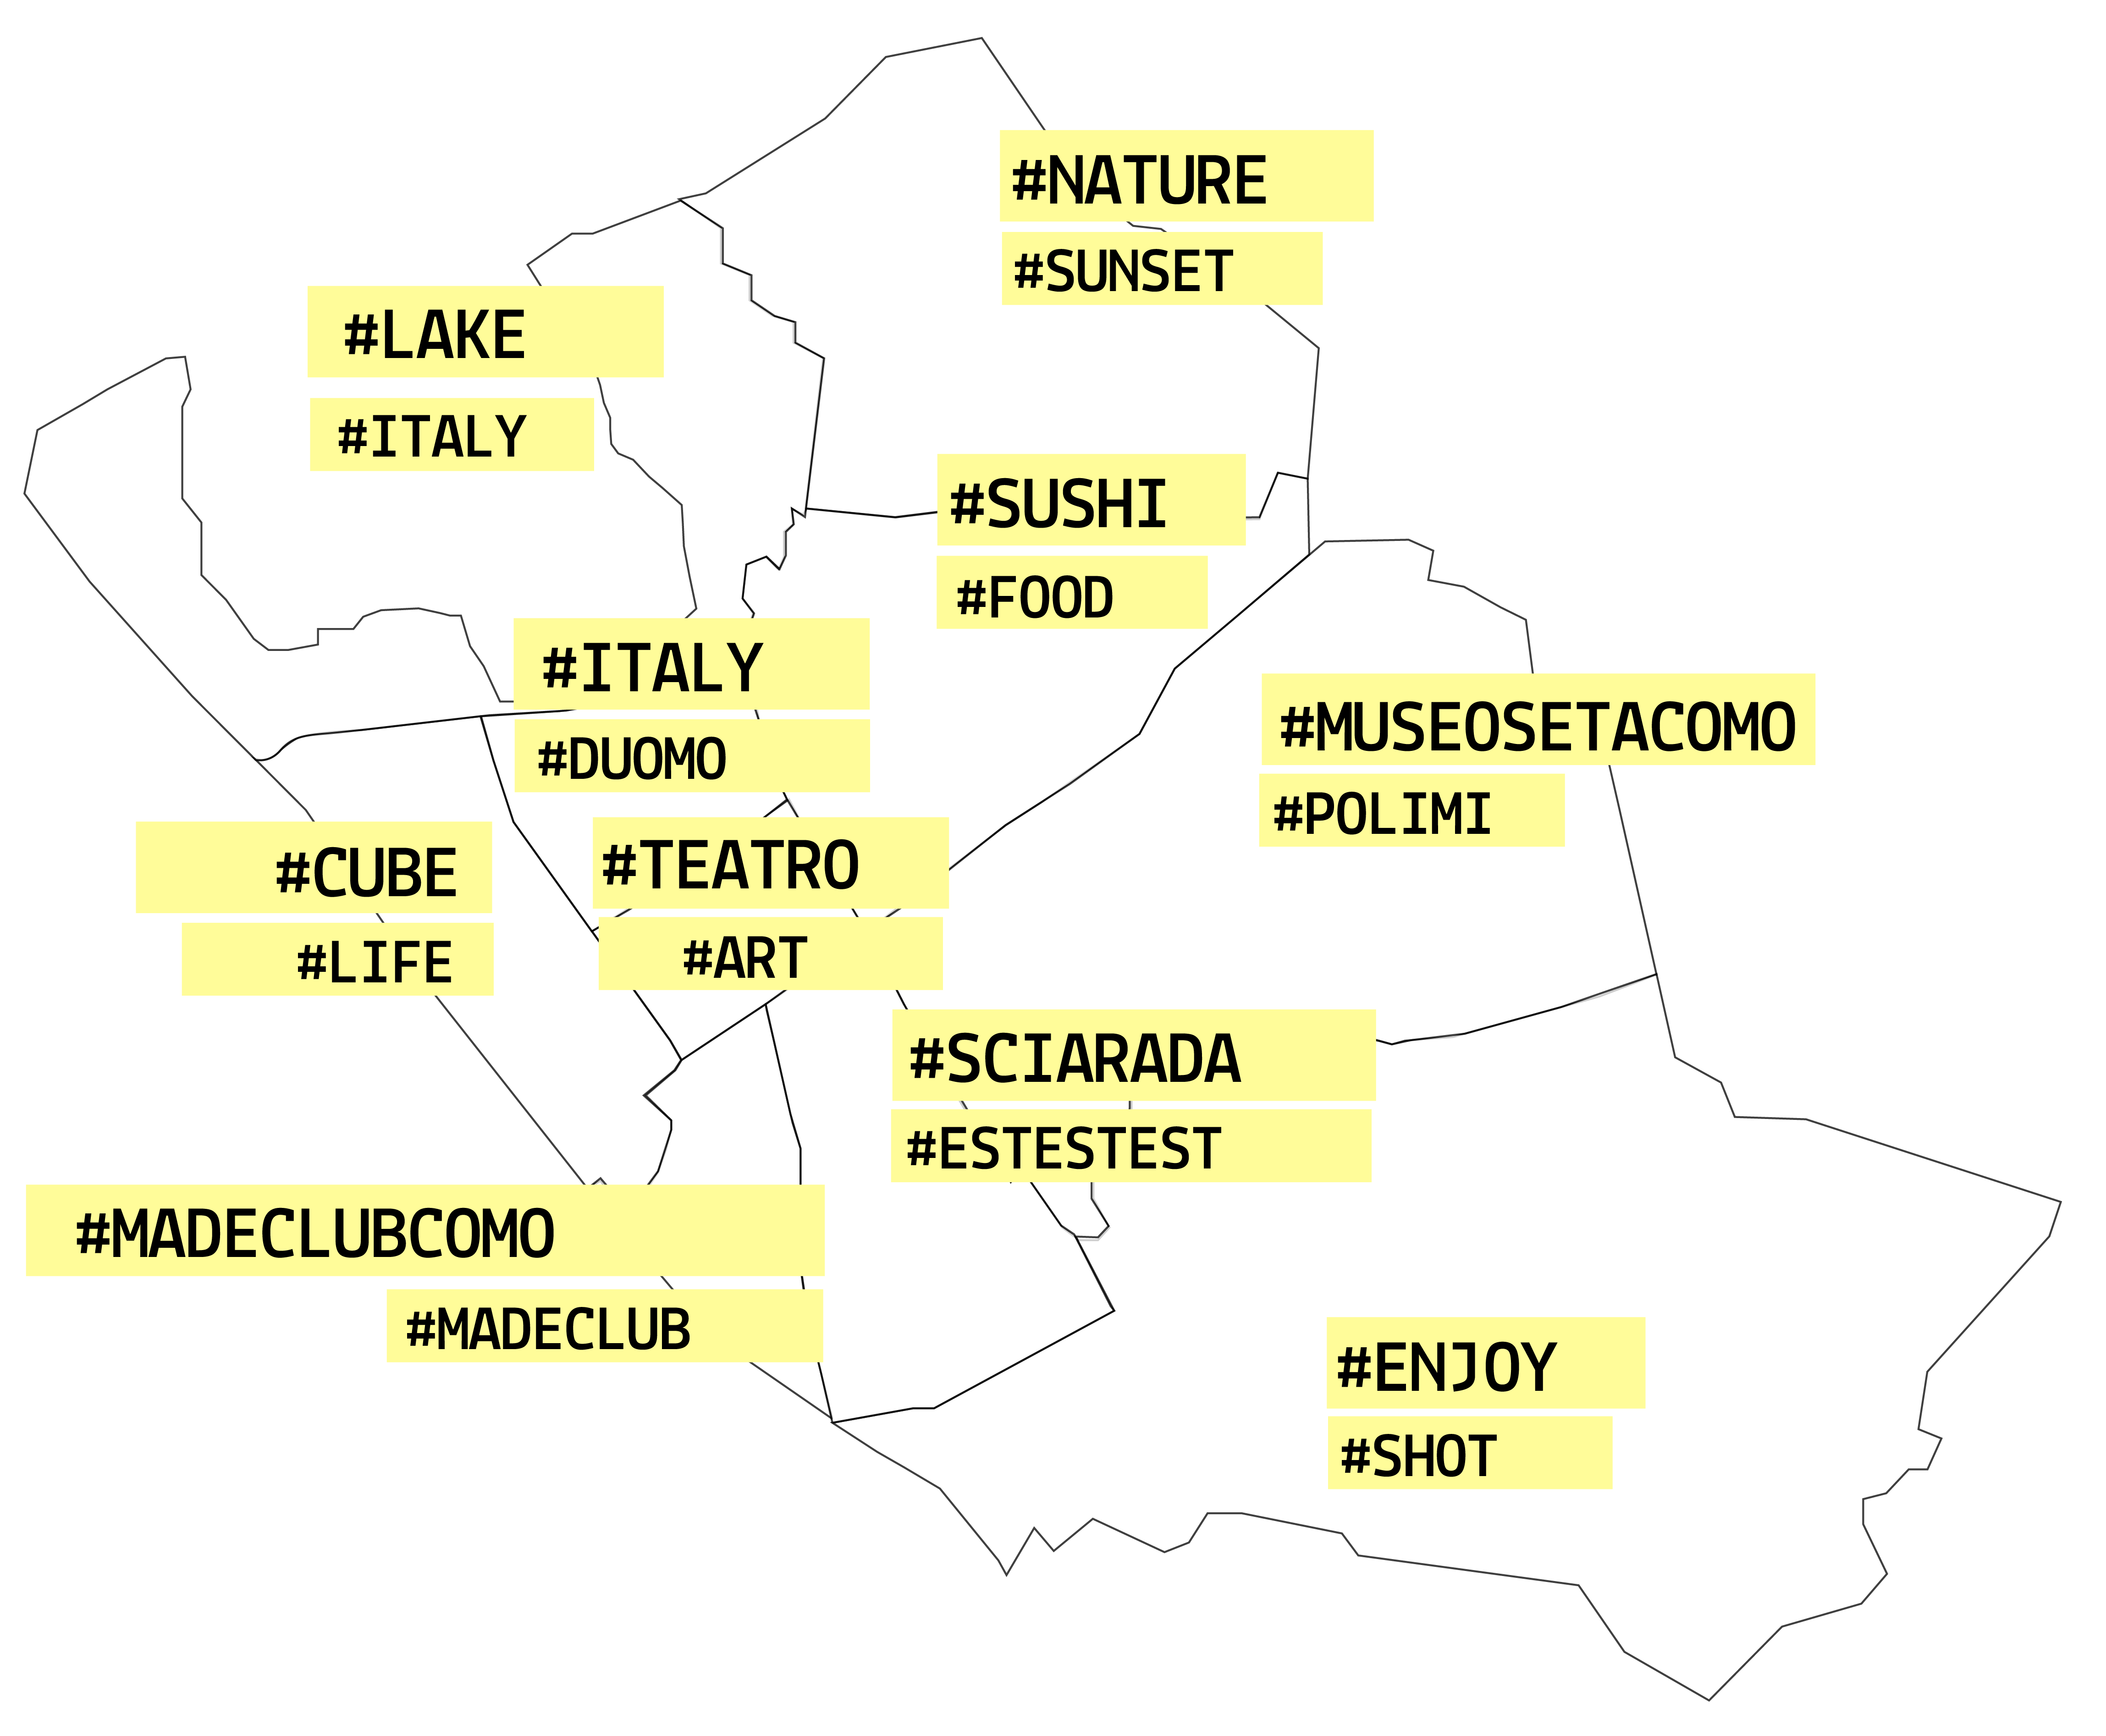
The hashtags and comments of Instagram posts bucketed by region were analysed using tf-idf, a method of representing
importance of words based on their occurrence in each post relative to an entire corpus (more info here).
This has the effect of weigh less frequently occuring words. Stop words were also removed.
From this analysis we extracted a representative set of hashtags for each region and separately
chose an Instagram picture which represented the activity in each region.
These analyses resulted in a general view of the city from the social media point of view:
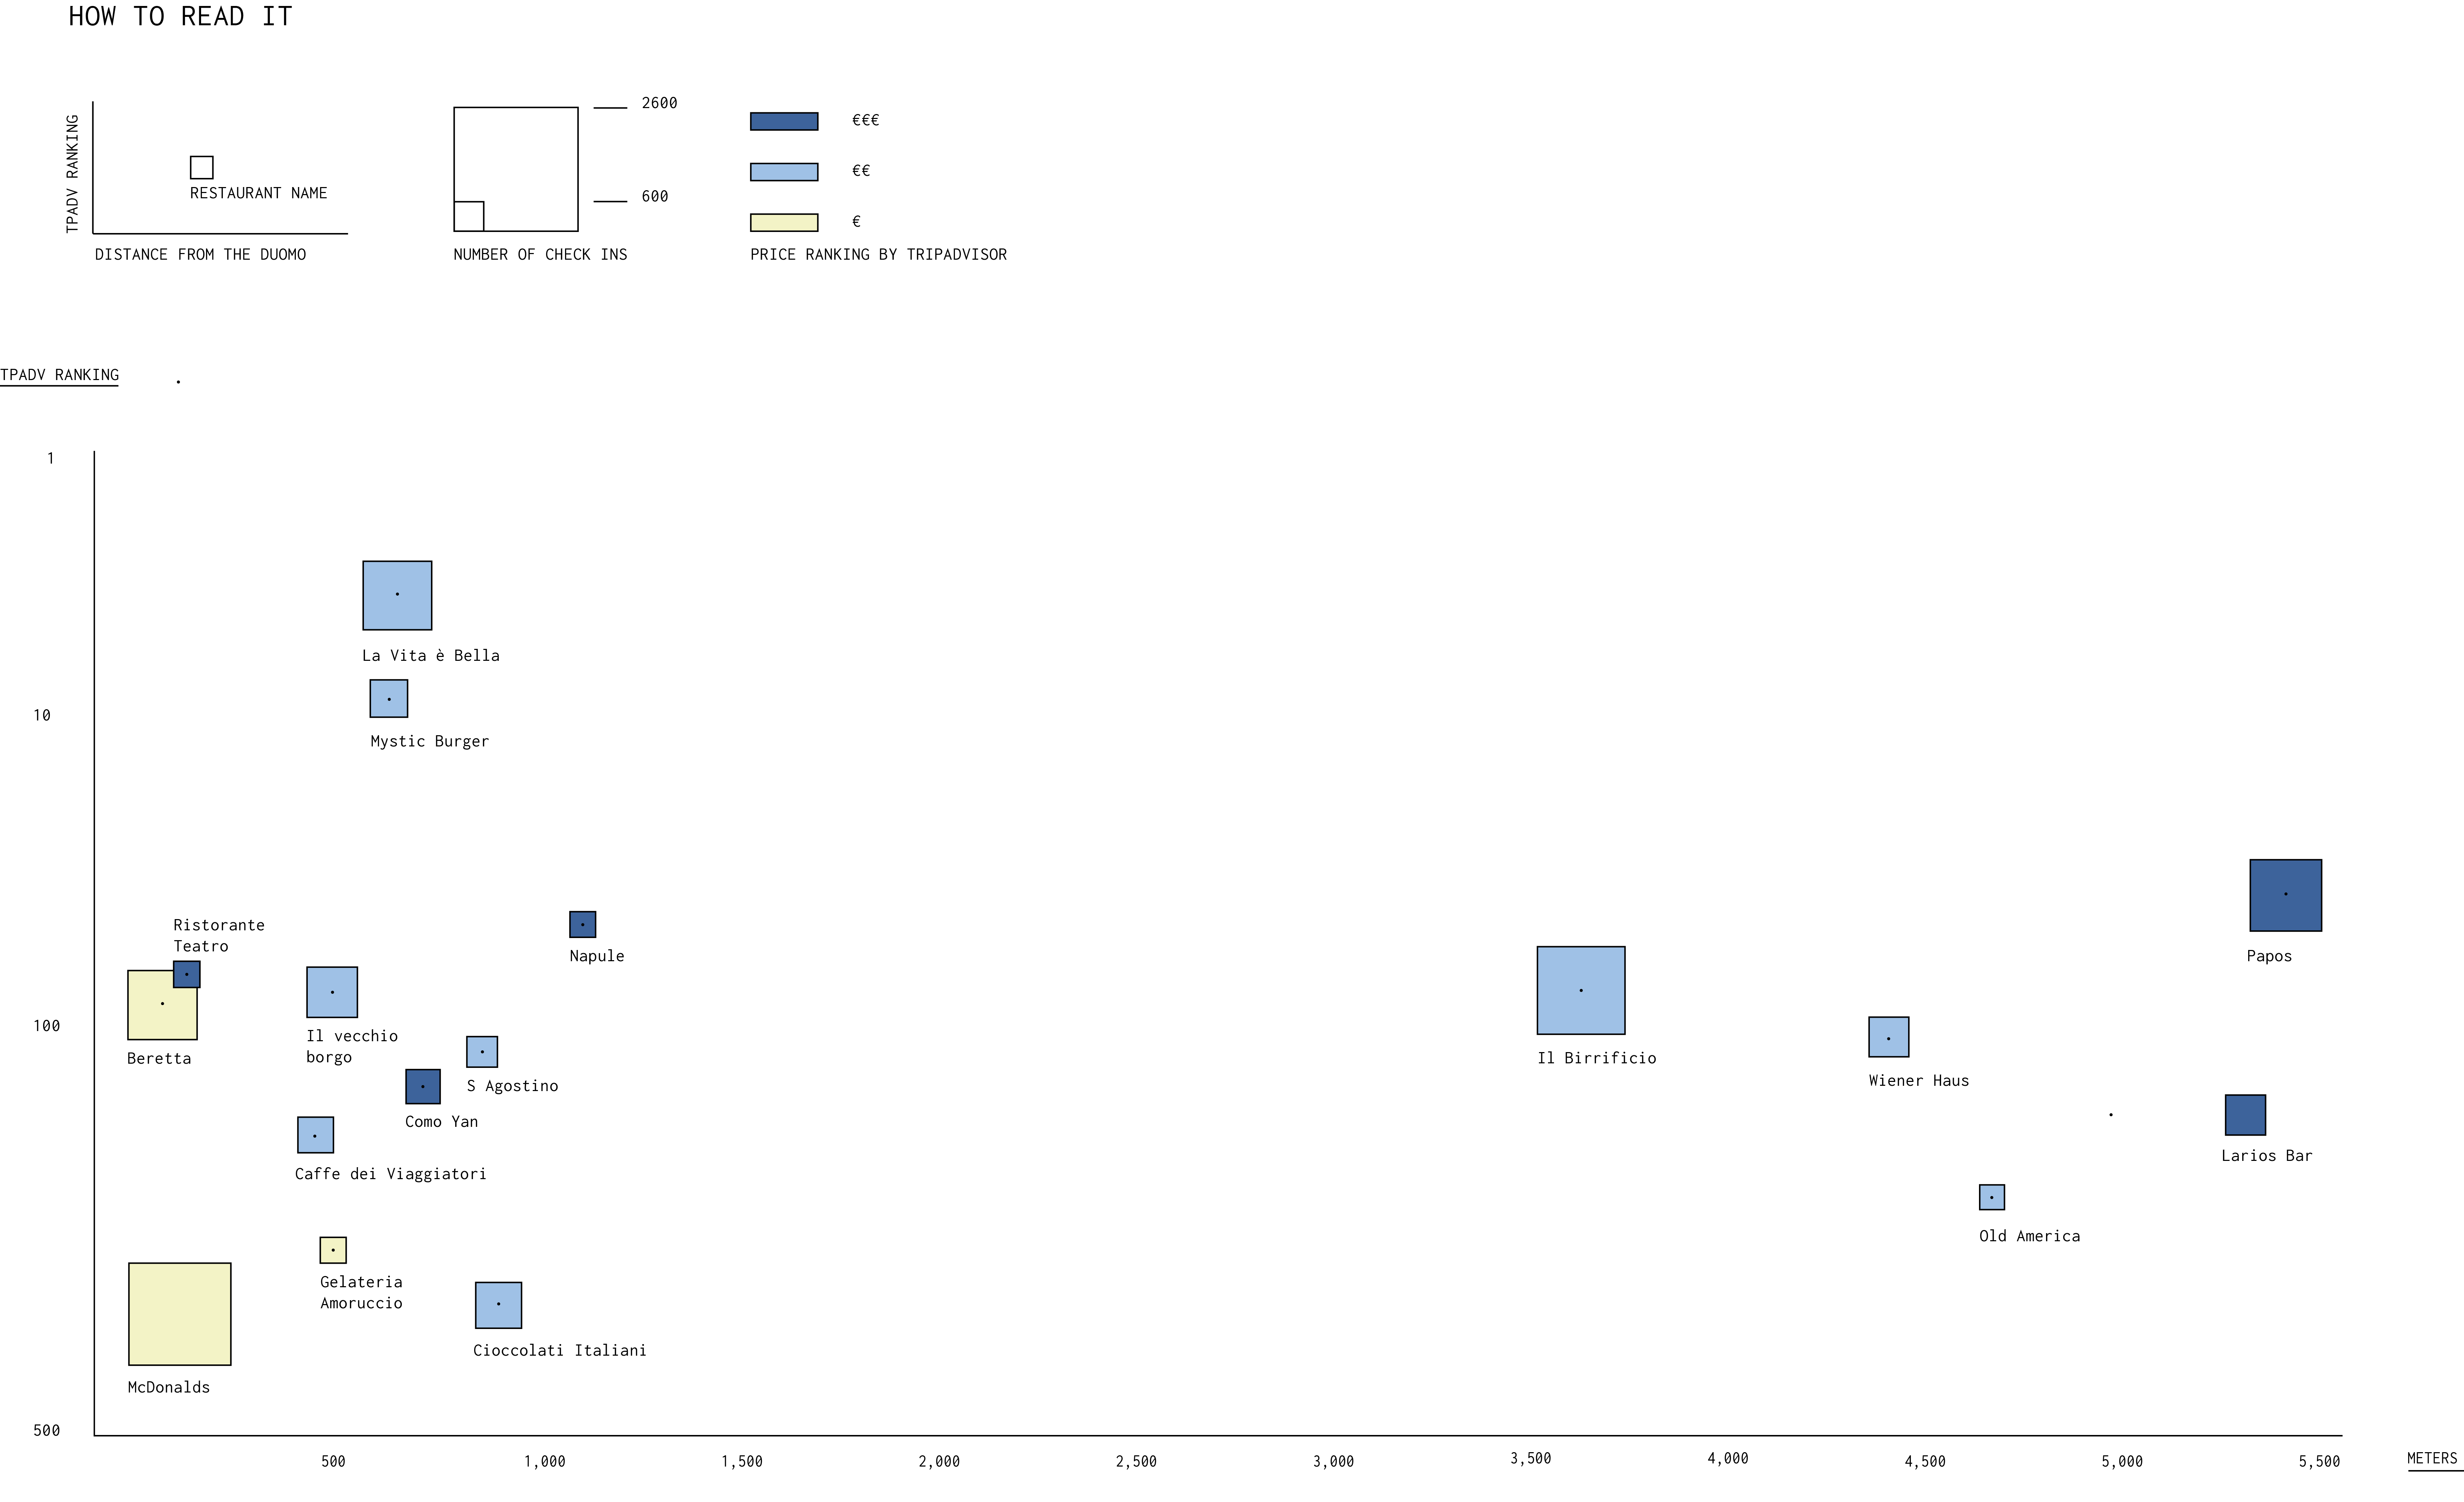
TripAdvisor data pointed out the general interests of tourists, showing how they move from the
main monuments and attractions during the day to the restaurants in the evening.
In a similar way, the Instagram data gave an insight into the most significant places in each of the telecom regions,
highlighting the main attractions of the city for young people during the day and during the night.
It is also clear that the pictures and activities dramatically change between seasons.
Top two hashtags. Tuesday
Top two hashtags. saturday
TRIPADVISOR CHECKINS - TUESDAY AND SATURDAY
Saturday
Tuesday
Where do people go after 8pm?
MEETING WITH THE MUNICIPALITY
In our initial meetings with the city, they expressed an interest in understanding
one particular movement pattern - Como seems to empty out after 8pm whereas historically this
has not been the case.
Exploration of the telecom data reinforced this view,
however the only reliable data source we had to infer motivations for movement was the
TripAdvisor data which predominantly reflects tourist activity only.