Key Word(s): ??
In [1]:
import pandas as pd
import numpy as np
import matplotlib.pyplot as plt

from scipy.interpolate import splrep
from scipy.interpolate import BSpline

%matplotlib inline
In [2]:
df = pd.read_csv('data1.csv')
df = df.sort_values('x')
df.head()
Out[2]:
In [3]:
plt.scatter(df.x, df.y);
plt.xlabel("x")
plt.ylabel("y")
plt.show()

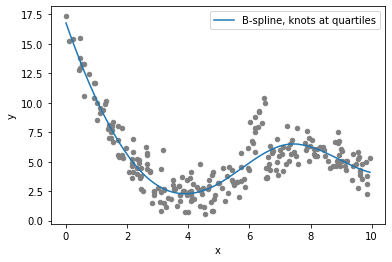
A (cubic) B-spline regression of y on x, with knots chosen at the quartiles.
In [4]:
#Get quartiles (knots)
quarts = df['x'].quantile([0.25, 0.5, 0.75]).values.reshape(-1)
print(quarts)
In [0]:
### edTest(test_splrep) ###
#Find the BSpline representation using splrep()
def test_splrep():
    t,c,k = splrep(________)
    return t,c,k

t,c,k = test_splrep()
#A tuple (t,c,k) containing the vector of knots, the B-spline coefficients, and the degree of the spline.
In [0]:
### edTest(test_bspline_model) ###
def test_bspline_model():
    return BSpline(_______)

b_spline_model = test_bspline_model()
In [0]:
ax = df.plot.scatter(x='x',y='y',c='grey')
ax.plot(df['x'], b_spline_model(df['x']), label="B-spline, knots at quartiles")
plt.legend()
plt.show()