Instructions:
- Read the dataset
heart.csvas a pandas dataframe, and take a quick look at the data. - Assign the predictor and response variables as per the instructions given in the scaffold.
- Set a max_depth value.
- Define a
DecisionTreeClassifierand fit on the entire data. - Define a
RandomForestClassifierand fit on the entire data. - Calculate Permutation Importance for each of the two models. Remember that the MDI is automatically computed by sklearn when you call the classifiers.
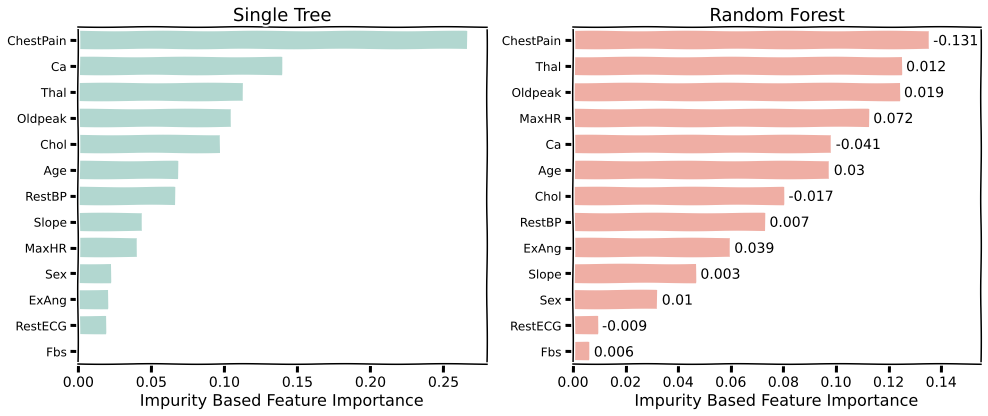
- Use the routines provided to display the feature importance of bar plots. The plots will look similar to the one given above.
Hints:
forest.feature_importances_ : Calculate the impurity-based feature importance.
sklearn.inspection.permutation_importance() : Calculate the permutation-based feature importance.
sklearn.RandomForestClassifier() : Returns a random forest classifier object.
sklearn.DecisionTreeClassifier(): Returns a decision tree classifier object.
NOTE - MDI is automatically computed by sklearn by calling RandomForestClassifier and/or DecisionTreeClassifier.
In [ ]:
# Import the necessary libraries
import numpy as np
import pandas as pd
import matplotlib.pyplot as plt
from sklearn.ensemble import RandomForestClassifier
from sklearn.model_selection import train_test_split
from sklearn.inspection import permutation_importance
from sklearn.tree import DecisionTreeClassifier
from helper import plot_permute_importance, plot_feature_importance

%matplotlib inline
In [ ]:
# Read the dataset and take a quick look

df = pd.read_csv("heart.csv")

df.head()
In [ ]:
# Assign the predictor and response variables.

# 'AHD' is the response and all the other columns are the predictors
X = ___
y = ___
In [ ]:
# Set the parameters

# The random state is fized for testing purposes

random_state = 44

# Choose a `max_depth` for your trees

max_depth = ___
SINGLE TREE
In [ ]:
### edTest(test_decision_tree) ###

# Define a Decision Tree classifier with random_state as the above defined variable
# Set the maximum depth to be max_depth

tree = __

# Fit the model on the entire data
tree.fit(X, y);

# Using Permutation Importance to get the importance of features for the Decision Tree
# With random_state as the above defined variable

tree_result = ___
RANDOM FOREST
In [ ]:
### edTest(test_random_forest) ###

# Define a Random Forest classifier with random_state as the above defined variable
# Set the maximum depth to be max_depth and use 10 estimators

forest = ___

# Fit the model on the entire data

forest.fit(X, y);

# Use Permutation Importance to get the importance of features for the Random Forest model
# With random_state as the above defined variable

forest_result = ___
PLOTTING THE FEATURE RANKING
In [ ]:
# Use the helper code given to visualize the feature importance using 'MDI'

plot_feature_importance(tree,forest,X,y);

# Use the helper code given to visualize the feature importance using 'permutation feature importance'

plot_permute_importance(tree_result,forest_result,X,y);
Your answer here
Q2. After marking, change the max_depth for your classifiers to a very low value such as $3$, and see if you see a change in the relative importance of predictors.
Your answer here