Key Word(s): Logistic Regression, Classification, kNN
Dataset Description:
The dataset used here is called the Heart dataset. This dataset has several predictors such as Age, Sex, and MaxHR, etc.
Instructions:
- Run the code, play around with thresholds and regularization parameters, and determine what the effect is on the misclassifications, ROC Curve, and AUC.
- Hint: why aren't we plotting like in the last exercise?
Hints:
sklearn.LogisticRegression() : Generates a Logistic Regression classifier
sklearn.fit() : Fits the model to the given data
sklearn.predict() : Predict using the estimated model (Logistic or knn classifiers) to perform pure classification predictions
sklearn.predict_proba() : Predict using the estimated model (Logistic or knn classifiers) to perform probability predictions of all the classes in the response (they should add up to 1 for each observation)
sklearn.LogisticRegression.coef_ and .intercept_ : Pull off the estimated $\beta$ coefficients in a Logistic Regression model
sklearn.confusion_matrix() : Calculate the confusion matrix
sklearn.roc_curve() : Calculate the ROC curve
sklearn.roc_auc_score() : Calculate the Area under the curve
Note: This exercise is NOT auto-graded.
import pandas as pd
import numpy as np
import sklearn as sk
import matplotlib.pyplot as plt
%matplotlib inline

from sklearn.linear_model import LogisticRegression
from sklearn import metrics
from sklearn.preprocessing import PolynomialFeatures

from sklearn.model_selection import train_test_split
heart = pd.read_csv('Heart.csv')

# Force the response into a binary indicator:
heart['AHD'] = 1*(heart['AHD'] == "Yes")

heart_train, heart_test = train_test_split(heart, test_size=0.3, random_state = 109)
degree = 3
predictors = ['Age','Sex','MaxHR','RestBP','Chol']

X_train = PolynomialFeatures(degree=degree,include_bias=False).fit_transform(heart_train[predictors])
y_train = heart_train['AHD']

X_test = PolynomialFeatures(degree=degree,include_bias=False).fit_transform(heart_test[predictors])
y_test = heart_test['AHD']


logit = LogisticRegression(penalty='none', max_iter = 10000).fit(X_train, y_train)
logit_ridge = LogisticRegression(C=0.001, penalty='l2',solver='lbfgs', max_iter = 10000).fit(X_train, y_train)
yhat_logit = logit.predict_proba(X_test)[:,1]
yhat_logit_ridge = logit_ridge.predict_proba(X_test)[:,1]

threshold = 0.5

print('The confusion matrix in test for logit when cut-off is',threshold, ': \n',
      sk.metrics.confusion_matrix(y_test, yhat_logit>threshold))
print('The confusion matrix in test for logit_ridge when cut-off is',threshold, ': \n',
      sk.metrics.confusion_matrix(y_test, yhat_logit_ridge>threshold))
######
# your code here
######
yhat_logit= logit.predict_proba(X_test)[:,1]
yhat_logit_ridge= logit_ridge.predict_proba(X_test)[:,1]
fpr, tpr, thresholds = metrics.roc_curve(y_test, yhat_logit)
fpr_ridge, tpr_ridge, thresholds_ridge = metrics.roc_curve(y_test, yhat_logit_ridge)
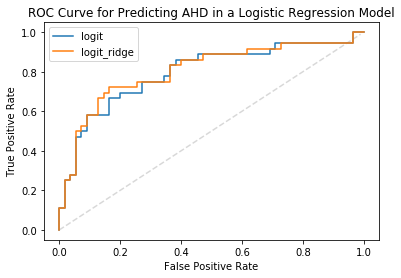
x=np.arange(0,100)/100
plt.plot(x,x,'--',color="gray",alpha=0.3)
plt.plot(fpr,tpr,label="logit")
plt.plot(fpr_ridge,tpr_ridge,label="logit_ridge")
plt.ylabel("True Positive Rate")
plt.xlabel("False Positive Rate")
plt.title("ROC Curve for Predicting AHD in a Logistic Regression Model")
plt.legend()
plt.show()
print(metrics.auc(fpr,tpr))
print(metrics.auc(fpr_ridge,tpr_ridge))