Key Word(s): Logistic Regression, Classification, kNN
Instructions:
We are trying to predict who will claim insurance as a function of age using the data. To do so we need :
- Read the
insurance_claim.csvas a dataframe. - Assign the predictor and response variables.
- Guesstimate the values of the coefficients $\hat{\beta}_0$ and $\hat{\beta}_1$.
- Predict the response variable using the formula of a simple logistic regression given below (no package allowed)
- Compute the accuracy of the model.
- Repeat the above steps by changing the values of the coefficients $\hat{\beta}_0$ and $\hat{\beta}_1$, until you get "good" accuracy.
- Plot the
Insurance Claimvs.Agegraph with the fit of the model.
Hints:
- Logistic Regression equation:
plt.plot() : Plots x versus y as lines and/or markers
sklearn.accuracy_score() : Accuracy classification score
plt.xticks() : Get or set the current tick locations and labels of the x-axis.
plt.yticks() : Get or set the current tick locations and labels of the y-axis.
plt.xlabel() : Set the label for the x-axis.
plt.ylabel() : Set the label for the y-axis.
Note: This exercise is auto-graded and you can try multiple attempts.
# import important libraries

%matplotlib inline
import numpy as np
import pandas as pd
from math import exp
import matplotlib.pyplot as plt
from sklearn.preprocessing import normalize
from sklearn.metrics import accuracy_score
# Make a dataframe of the file "insurance_claim.csv"

data_filename = 'insurance_claim.csv'
df = pd.read_csv(data_filename)
# Take a quick look of the data, notice that the response variable is binary

df.head()
# Assign age as the predictor variable using double brackets
x = df[[___]]

# Assign insuranceclaim as the response variable
y = df[___]
# Make a plot of the response (insuranceclaim) vs the predictor (age)
plt.plot(___,___,'o', markersize=7,color="#011DAD",label="Data")

# Also add the labels for 'x' & 'y' values
plt.xlabel(___)
plt.ylabel(___)

plt.xticks(np.arange(18, 80, 4.0))

# Label the value 1 as 'Yes' & 0 as 'No'
plt.yticks((0,1), labels=('No', 'Yes'))
plt.legend(loc='best')
plt.show()
### edTest(test_beta_guesstimate) ###
# Guesstimate the values of beta0 & beta1

beta0 = ___

beta1 = ___
### edTest(test_beta_computation) ###
# Use the logistic function below to predict the response based on the input
logit = []

for i in x:
    # Append the P(y=1) values to the logit list
    logit.append(___)
# If the predictions are above a threshold of 0.5, predict as 1, else 0

y_pred = []

for py in ___:
    if py >= 0.5:
        ____
    else:
        ____
# Use accuracy_score function to find the accuracy

accuracy = accuracy_score(___, ___)

# Print the accuracy
print (___)
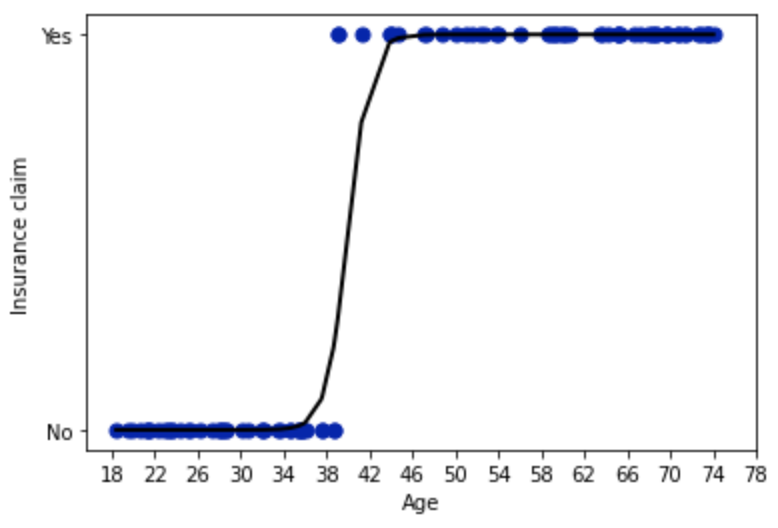
# Make a plot similar to the one above along with the fit curve
plt.plot(___, ___,'o', markersize=7,color="#011DAD",label="Data")

plt.plot(___,___,linewidth=2,color='black',label="Prediction")

plt.xticks(np.arange(18, 80, 4.0))
plt.xlabel("Age")
plt.ylabel("Insurance claim")
plt.yticks((0,1), labels=('No', 'Yes'))
plt.legend()
plt.show()
Post exercise question:
In this exercise, you may have had to stumble around to find the right values of $\beta_0$ and $\beta_1$ to get accurate results.
Although you may have used visual inspection to find a good fit, in most problems you would need a quantative method to measure the performance of your model. (Loss function)
Which of the following below are NOT possible ways of quantifying the performance of the model.
- A. Compute the mean squared error loss of the predicted labels.
- B. Evaluate the log-likelihood for this Bernoulli response variable.
- C. Go the the temple of Apollo at Delphi, and ask the high priestess Pythia
- D. Compute the total number of misclassified labels.
### edTest(test_quiz) ###

# Put down your answers in a string format below (using quotes)

# for. eg, if you think the options are 'A' & 'B', input below as "A,B"

answer = ___