Roadmap
- Get a new dataframe using the RandomUniverse function already provided in the exercise
- Calculate $\beta_0$, $\beta_1$ for that particular dataframe
- Add the calculated $\beta_0$ and $\beta_1$ values to a python list
- Plot a histogram using the lists calculated above
Change the number of parallelUniverses and comment on what you observe. Discuss within the group why you see this behavior. Did you expect the spread to change? Why or why not?
Hints
- To compute the beta values use the following equations:
$\beta_{0}=\bar{y}-\left(b_{1} * \bar{x}\right)$
$\beta_{1}=\frac{\sum(x-\bar{x}) *(y-\bar{y})}{\sum(x-\bar{x})^{2}}$
where $\bar{x}$ is the mean of $x$ and $\bar{y}$ is the mean of $y$
np.dot() : Computes the dot product of two arrays
ax.hist() : Plots a histogram
ax.set_xlabel() : Sets label for x-axis
ax.set_ylabel() : Sets label for the y-axis
Note: This exercise is auto-graded and you can try multiple attempts.
import pandas as pd
import numpy as np
import matplotlib.pyplot as plt
from randomuniverse import RandomUniverse
%matplotlib inline
Reading the standard Advertising dataset
df = pd.read_csv('Advertising_adj.csv')
df.head()
#Create two empty lists that will store the beta values
beta0_list, beta1_list = [],[]


#Choose the number of "parallel" Universes to generate the new dataset
parallelUniverses = 1000

for i in range(parallelUniverses):
    df_new = RandomUniverse(df)

# x is the predictor variable given by 'tv' values
# y is the reponse variable given by 'sales' values
    x = ___
    y = ___

#Find the mean of the x values
    xmean = x.___

#Find the mean of the y values
    ymean = y.___

# Using Linear Algebra as discussed in lecture for beta0 and beta1

    beta1 = ___
    beta0 = ___

# Append the calculated values of beta1 and beta0
    beta0_list.___
    beta1_list.___
### edTest(test_beta) ###
beta0_mean = np.mean(beta0_list)
beta1_mean = np.mean(beta1_list)
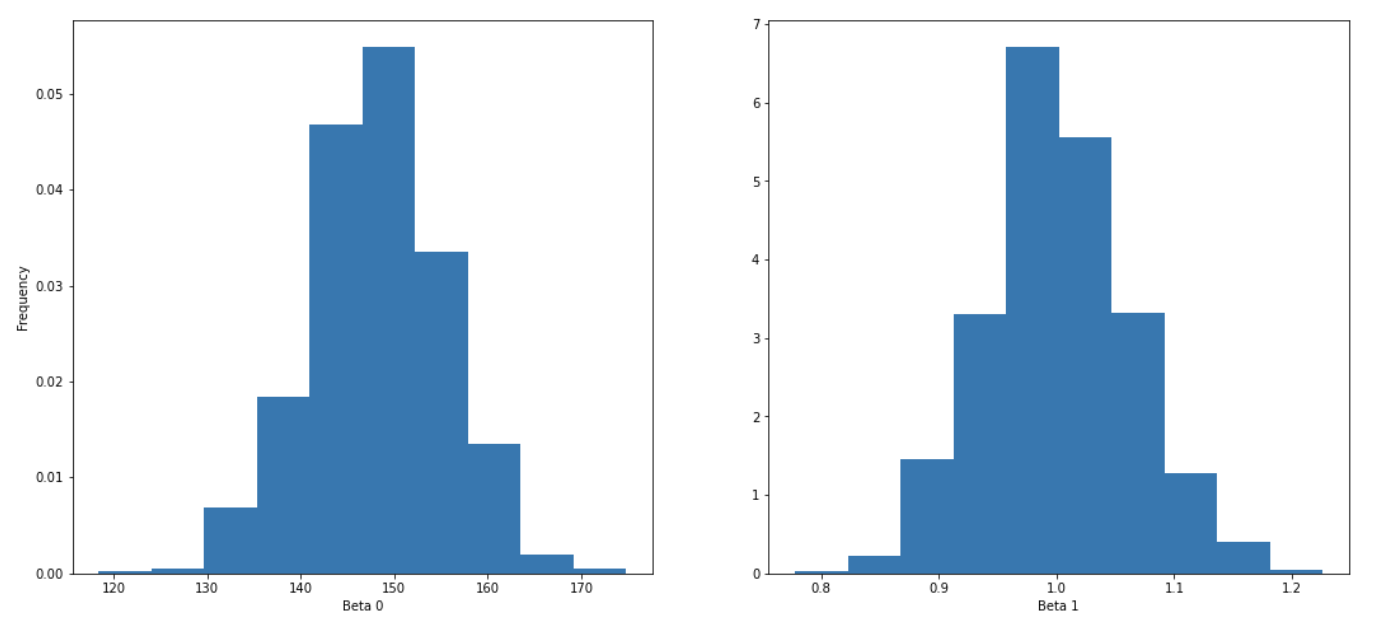
Now we plot the histograms
Returns a plot for a histogram
# plot histogram of
fig, ax = plt.subplots(1,2, figsize=(18,8))
ax[0].___
ax[1].___
ax[0].set_xlabel('Beta 0')
ax[1].set_xlabel('Beta 1')
ax[0].set_ylabel('Frequency');
Discussion
Change the number of parallelUniverses and comment on what you observe. Discuss within the group why you see this behavior. Did you expect the spread to change? Why or why not?
Fin