Key Word(s): Linear Regression
Title
Exercise: A.1 - Guesstimate the β values
Description
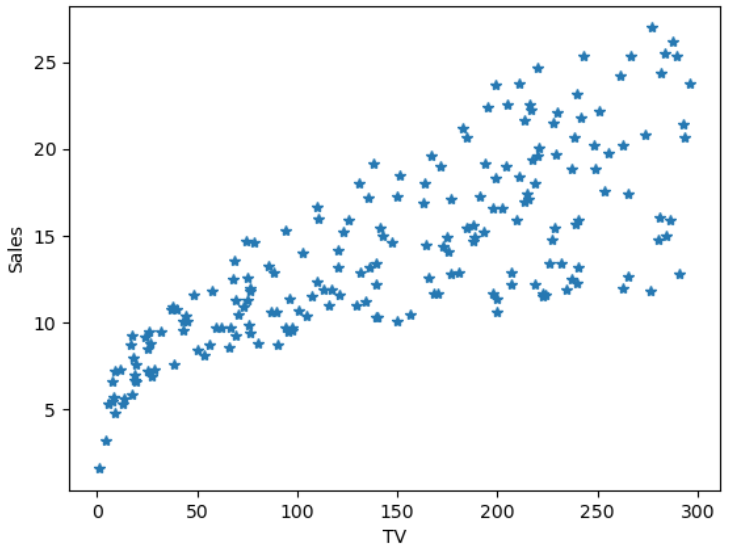
The goal of this exercise is to guess a model based on the plot below and also calculate the MSE for your guess model.
Instructions:
We are trying to predict sales as a function of the advertising budget for TV using the data. To do so we need 1) a model and 2) a method to estimate how good the model is.
- Guess the values of the coefficients $\beta_0$ and $\beta_1$ by visually inspecting the graph above;
- Plot your model's prediction (use the formula of a simple linear regression, no package allowed) ;
- Change the values of the coefficients $\beta_0$ and $\beta_1$ to improve the fit;
- Calculate the Mean Squared Error (MSE) for the model.
Hints:
- Recall the formula for the linear regression model $\hat{y}= \beta_0 + \beta_1*x$
- Recall the formula for Mean Squared Error $MSE =\frac{1}{n}\sum_{i=1}^{n}(y_i-\hat{y})^2$
- Guess $\beta_0$ by observing the intercept of your model and $\beta_1$ looking at the slope
np.mean() : Computes the arithmetic mean along the specified axis
plt.plot() : Plots x versus y as lines and/or markers
plt.xlabel() : Sets the label for the x-axis.
plt.ylabel() : Sets the label for the y-axis.
plt.legend() : Places a legend on the axes
Note: This exercise is auto-graded and you can try multiple attempts.
In [10]:
import numpy as np
import pandas as pd
import matplotlib.pyplot as plt
%matplotlib inline
Reading the dataset
In [11]:
# Data set used in this exercise :Advertising.csv
data_filename = 'Advertising.csv'

# Read the data using pandas libraries
df = pd.read_csv(data_filename)
In [3]:
# Create a new dataframe called `df_new` witch the columns 'TV' and 'sales'
df_new = df[['TV', 'sales']]
In [4]:
# Plot the data

plt.plot(df_new.TV, df_new.sales, '*', label='data')
plt.xlabel('TV')
plt.ylabel('Sales')
plt.legend()
Out[4]:

Beta Estimation
In [ ]:
### edTest(test_betas) ###
# Estimate beta0 by observing the value of y when x = 0
beta0 = ___

# Estimate beta1 - Check the slope for guidance
beta1 = ___
In [ ]:
# Calculate prediction of x using beta0 and beta1
y_predict = ___
Plotting the graph
In [ ]:
# Plot the predicted values as well as the data
plt.plot(df_new.TV, df_new.sales, '*', label='data')
plt.plot(df_new.TV, y_predict, label='model')
plt.xlabel('TV')
plt.ylabel('Sales')
plt.legend()
MSE Computation
In [ ]:
### edTest(test_mse) ###
# Calculate the MSE
MSE = ___

# Print the results
print("My MSE is: {0}".format(MSE))