Key Word(s): Linear Regression
Instructions:
We want to find the model that fit best the data. To do so we are going to
1) Use train_test_split() function to split the dataset into training and testing sets.
2) Use the LinearRegression function to make a model.
3) Fit the model on the training set
4) Predict on the testing set using the fit model.
5) Estimate the fit of the model using mean_squared_error function
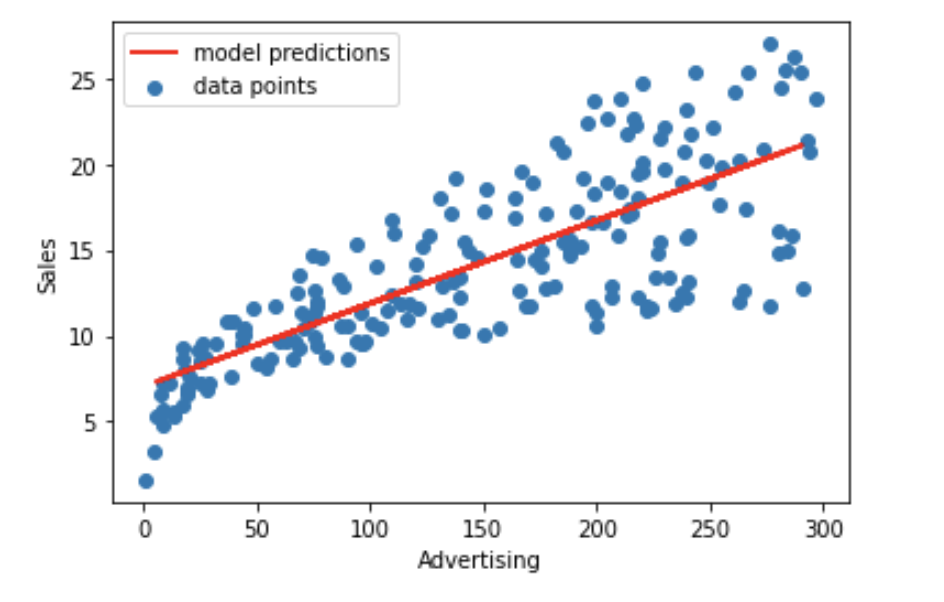
6) Plot the dataset along with the predictions to visualize the fit
Hints:
pd.read_csv(filename) : Returns a pandas dataframe containing the data and labels from the file data
sklearn.train_test_split() : Splits the data into random train and test subsets
sklearn.LinearRegression() : LinearRegression fits a linear model
sklearn.fit() : Fits the linear model to the training data
sklearn.predict() : Predict using the linear model.
Note: This exercise is auto-graded and you can try multiple attempts
# import required libraries

import numpy as np
import pandas as pd
import matplotlib.pyplot as plt
from sklearn.linear_model import LinearRegression
from sklearn.model_selection import train_test_split
from sklearn.metrics import mean_squared_error
from sklearn.metrics import r2_score
%matplotlib inline
# Read the 'Advertising.csv' dataset

data_filename = 'Advertising.csv'

# Read data file using pandas libraries

df = pd.read_csv(data_filename)
# Take a quick look at the data

df.head()
# Assign TV advertising as predictor variable 'x' and sales as response variable 'y'


x = df[["TV"]]
y = df["sales"]
# divide the data into training and validation sets

x_train, x_test, y_train, y_test = train_test_split(___,___,train_size=0.8)
# Use the sklearn function 'LinearRegression' to fit on the training set

model = LinearRegression()

model.fit(___, ___)

# Now predict on the test set

y_pred_test = model.predict(___)
### edTest(test_mse) ###
# Now compute the MSE with the predicted values and print it

mse = mean_squared_error(___, ___)
print(f'The test MSE is {___}')
# Make a plot of the data along with the predicted linear regression

fig, ax = plt.subplots()
ax.scatter(x,y,label='data points')
ax.plot(___,___,color='red',linewidth=2,label='model predictions')
ax.set_xlabel('Advertising')
ax.set_ylabel('Sales')
ax.legend()

Mindchow
Rerun the code but this time change the training size to 60%.
Did your test $MSE$ improve or get worse?
# your answer here