Key Word(s): The Data Science Process, Data Science Demo
 CS109A Introduction to Data Science
Lecture 1: Example
Harvard University
Fall 2020
Instructors: Pavlos Protopapas, Kevin Rader, and Chris Tanner
Title
Hub data, part 1: Reading data, examining them and formulate questions.
Description
Introduction: Hubway was metro-Boston’s public bike share program, with more than 1600 bikes at 160+ stations across the Greater Boston area. Hubway was owned by four municipalities in the area.
By 2016, Hubway operated 185 stations and 1750 bicycles, with 5 million ride since launching in 2011.
The Data: In April 2017, Hubway held a Data Visualization Challenge at the Microsoft NERD Center in Cambridge, releasing 5 years of trip data.
The Question: What does the data tell us about the ride share program?
The original question: ‘What does the data tell us about the ride share program?’ is a reasonable slogan to promote a hackathon. It is not good for guiding scientific investigation.
Before we can refine the question, we have to look at the data!
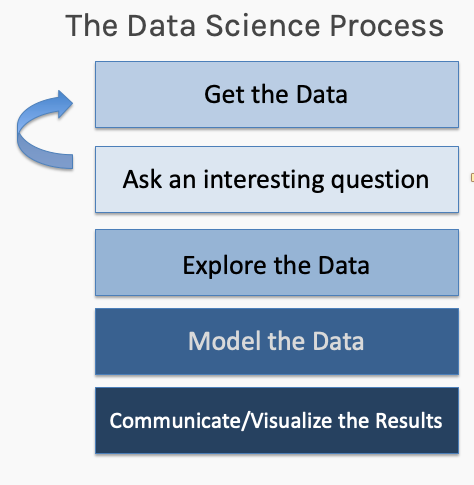
Note: Here we switch the order of the "data science process"
import sys
import zipfile
import datetime
import numpy as np
import scipy as sp
import pandas as pd
import seaborn as sns
import matplotlib.pyplot as plt

from math import radians, cos, sin, asin, sqrt
from sklearn.linear_model import LinearRegression

sns.set(style="ticks")
%matplotlib inline
Download the data from
https://drive.google.com/open?id=0B28c493CP9GtMzN1emFoMkJNNlU
import os

DATA_HOME = os.getcwd()
if 'ED_USER_NAME' in os.environ:
    DATA_HOME = '/course/data'

HUBWAY_STATIONS_FILE = os.path.join(DATA_HOME, 'hubway_stations.csv')
HUBWAY_TRIPS_FILE = os.path.join(DATA_HOME, 'hubway_trips_sample.csv')
hubway_data = pd.read_csv(HUBWAY_TRIPS_FILE, index_col=0, low_memory=False)
hubway_data.head()
Basic Summaries
hubway_data.describe()
What Type Of
hubway_data.dtypes
Go to Part 1 quiz and enter your questions. Once you are done return to the main room.